Details page
The details page shows a set of fields which are applicable to the related type of asset.
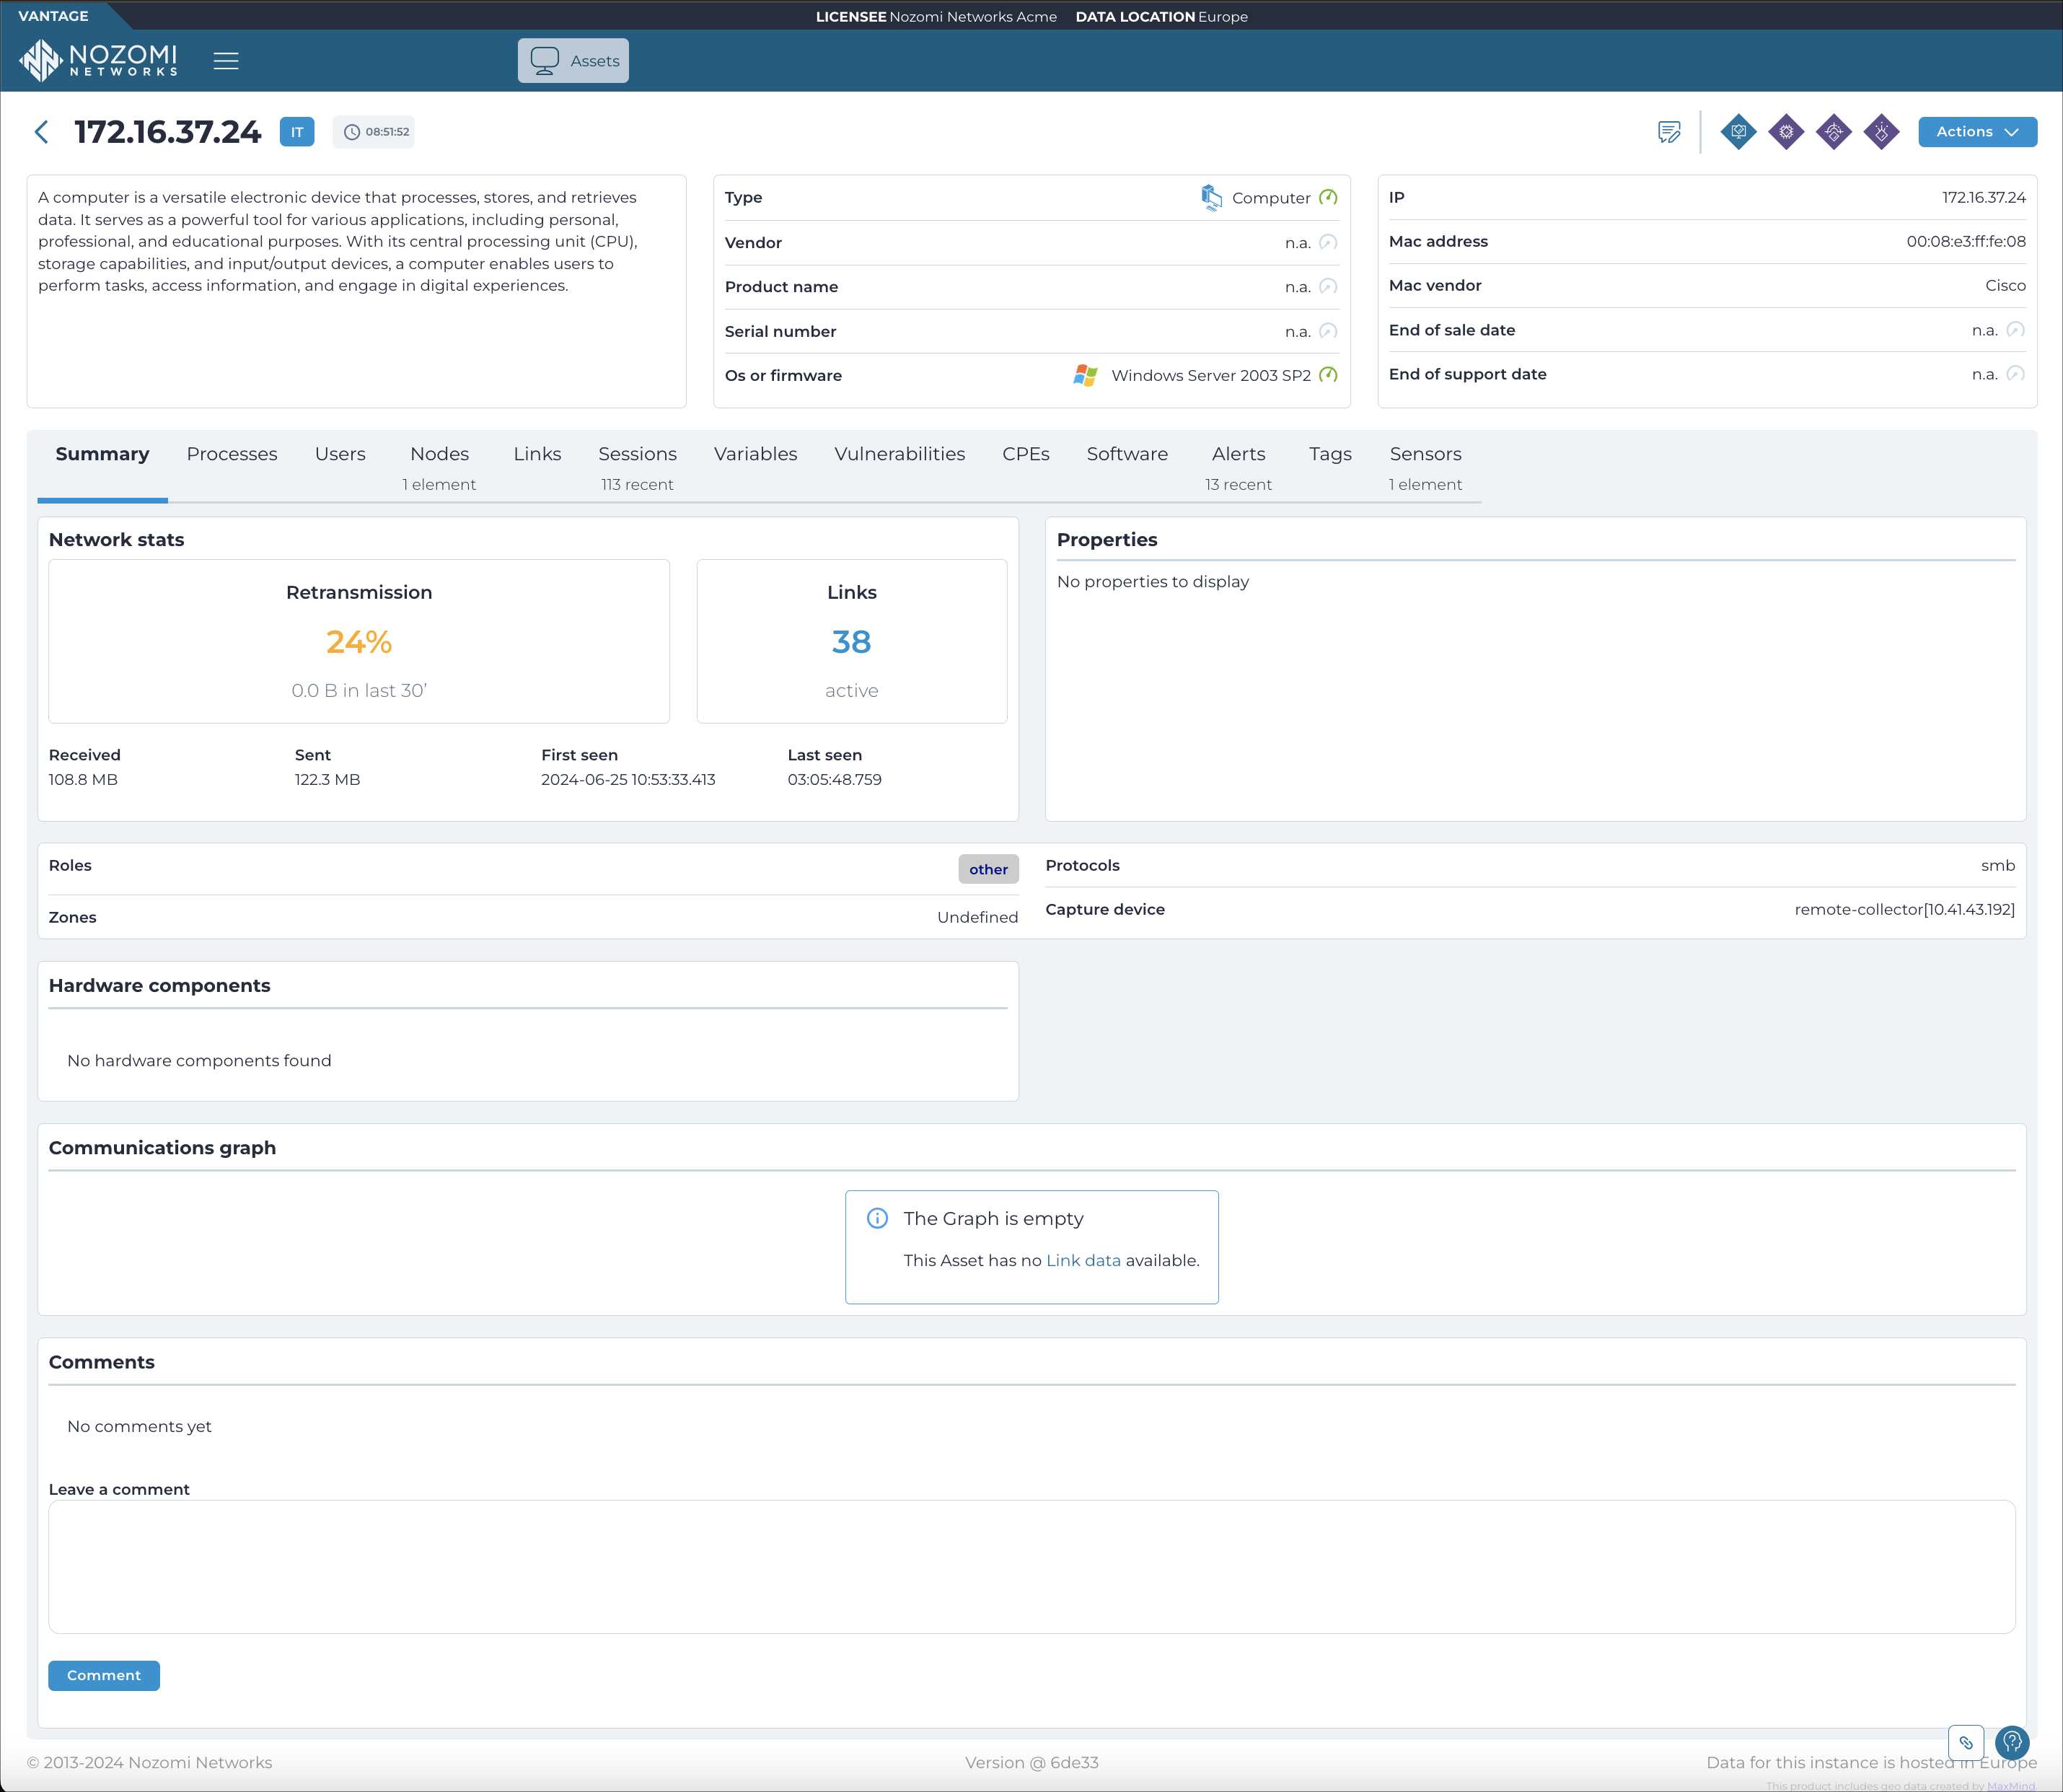
Actions dropdown
This dropdown gives you access to these actions:
- Delete
- Export (bulk option only)
- Create Asset Rule From This Asset
Tabs
The details page has these tabs: