Workbooks
The Workbooks page shows recommended courses of action that can improve your network security. Generated through machine learning, workbooks highlight the vulnerabilities currently creating the highest risk exposure.
Banner image
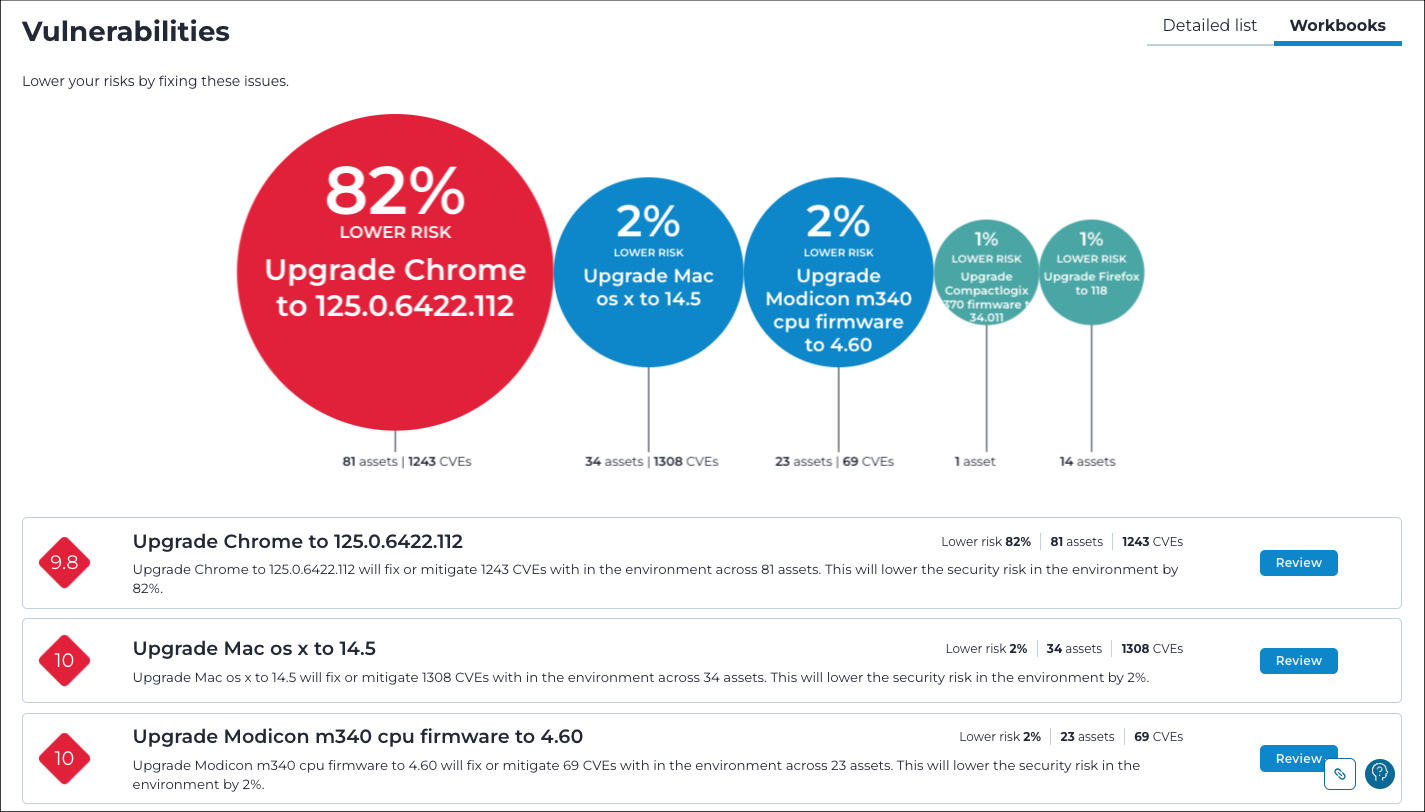
The banner image is a powerful visual report that uses bubble graphics to represent the relative impact of each workbook recommendation.
List
The list shows ranked recommendations, with the most effective actions at the top. For each workbook, Vantage shows:
- On the left, the highest risk score among all the vulnerabilities included in the workbook.
- A title that shows the recommended course of action.
- A description of the issue and the benefits of addressing it.
- In the top right corner of each workbook, Vantage shows:
- An assessment of the risk reduction you will achieve if you follow the recommended steps. It is shown as a percentage.
- The number of assets where the vulnerability was detected.
- The number of Common Vulnerabilities and Exposures (CVE) that you would address if you follow the recommended steps.