Graph
Displays a visual map of your network, highlighting asset connections and communication paths. Users can switch between network and physical views to explore infrastructure relationships.
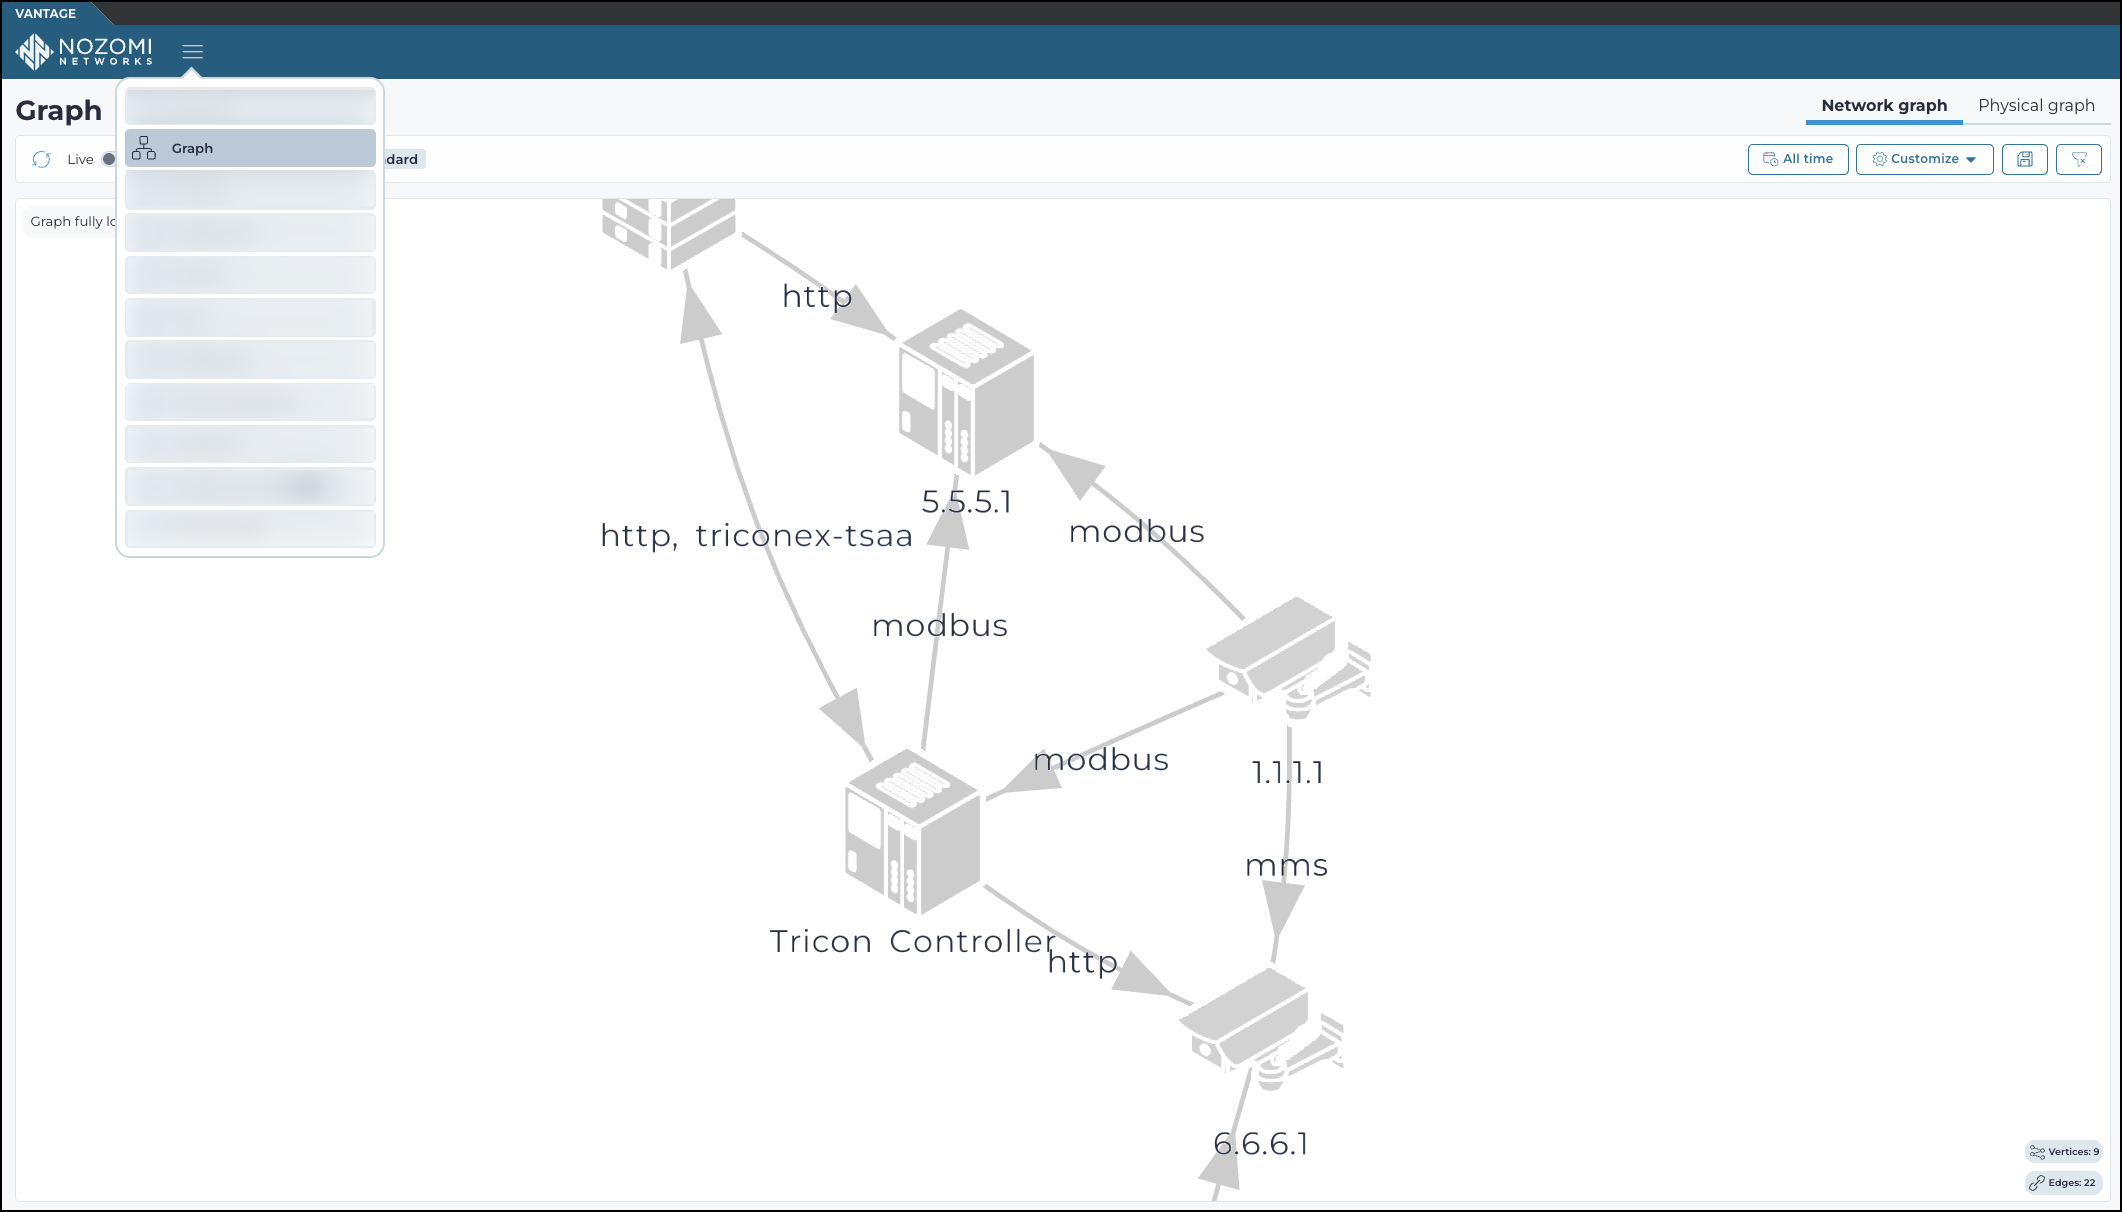
The Graph page has these tabs:
Displays a visual map of your network, highlighting asset connections and communication paths. Users can switch between network and physical views to explore infrastructure relationships.
The Graph page has these tabs: