Time Series
The Time Series page uses machine learning to detect and forecast abnormal network activity across your sensors and numeric variables.
With Time Series, you can predict and alert on abnormal activity from any sensor's or numeric variable's baseline using advanced machine learning techniques. Was the change expected or outside of the normal range of deviation for that period? Deep neural networks perform the forecasting and identify existing trends to predict forecast reliability using online signal analysis.
Setup
The Time Series page only shows items that have been individually enabled for IQ analysis. This includes sensors, and numeric variables for which variable history has been enabled. An item that has not been enabled does not appear in the Time Series list, even if your organization has a Vantage IQ license.
Time Series table
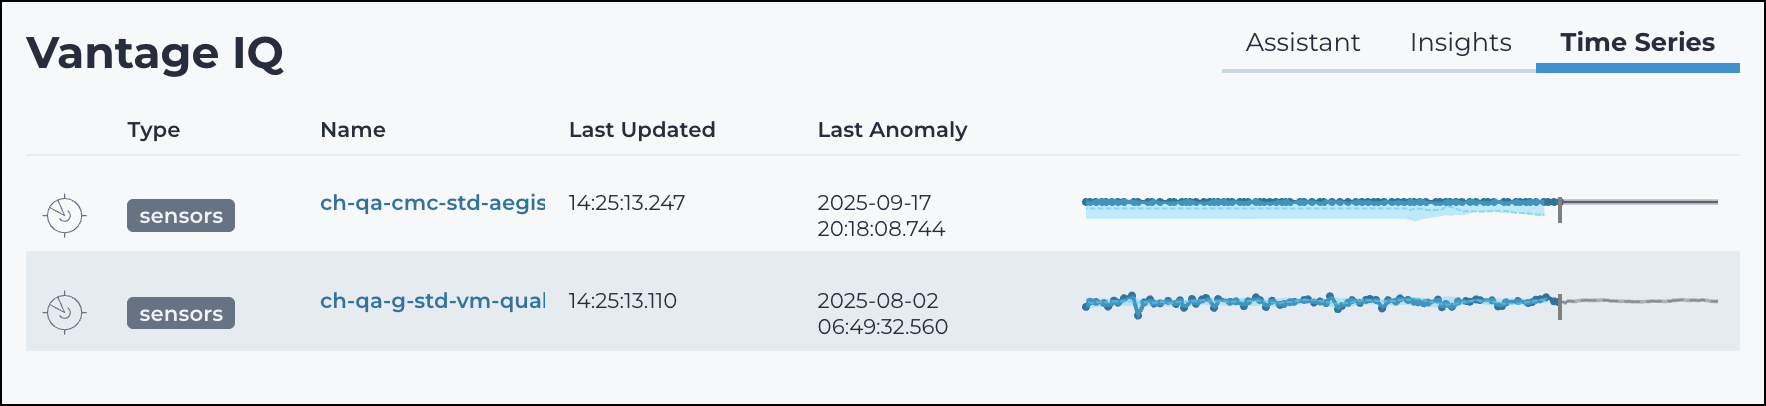
The table lists all sensors and numeric variables that have been enabled for Time Series monitoring. For each entry, the table shows:
- Sensor name: The name of the monitored sensor or variable
- Last updated: When the sensor's Time Series model was last updated
- Last anomaly: The timestamp of the most recent detected anomaly for that sensor
- Activity: A sparkline graph of recent network activity, showing observed values against the forecasted baseline