Physical graph
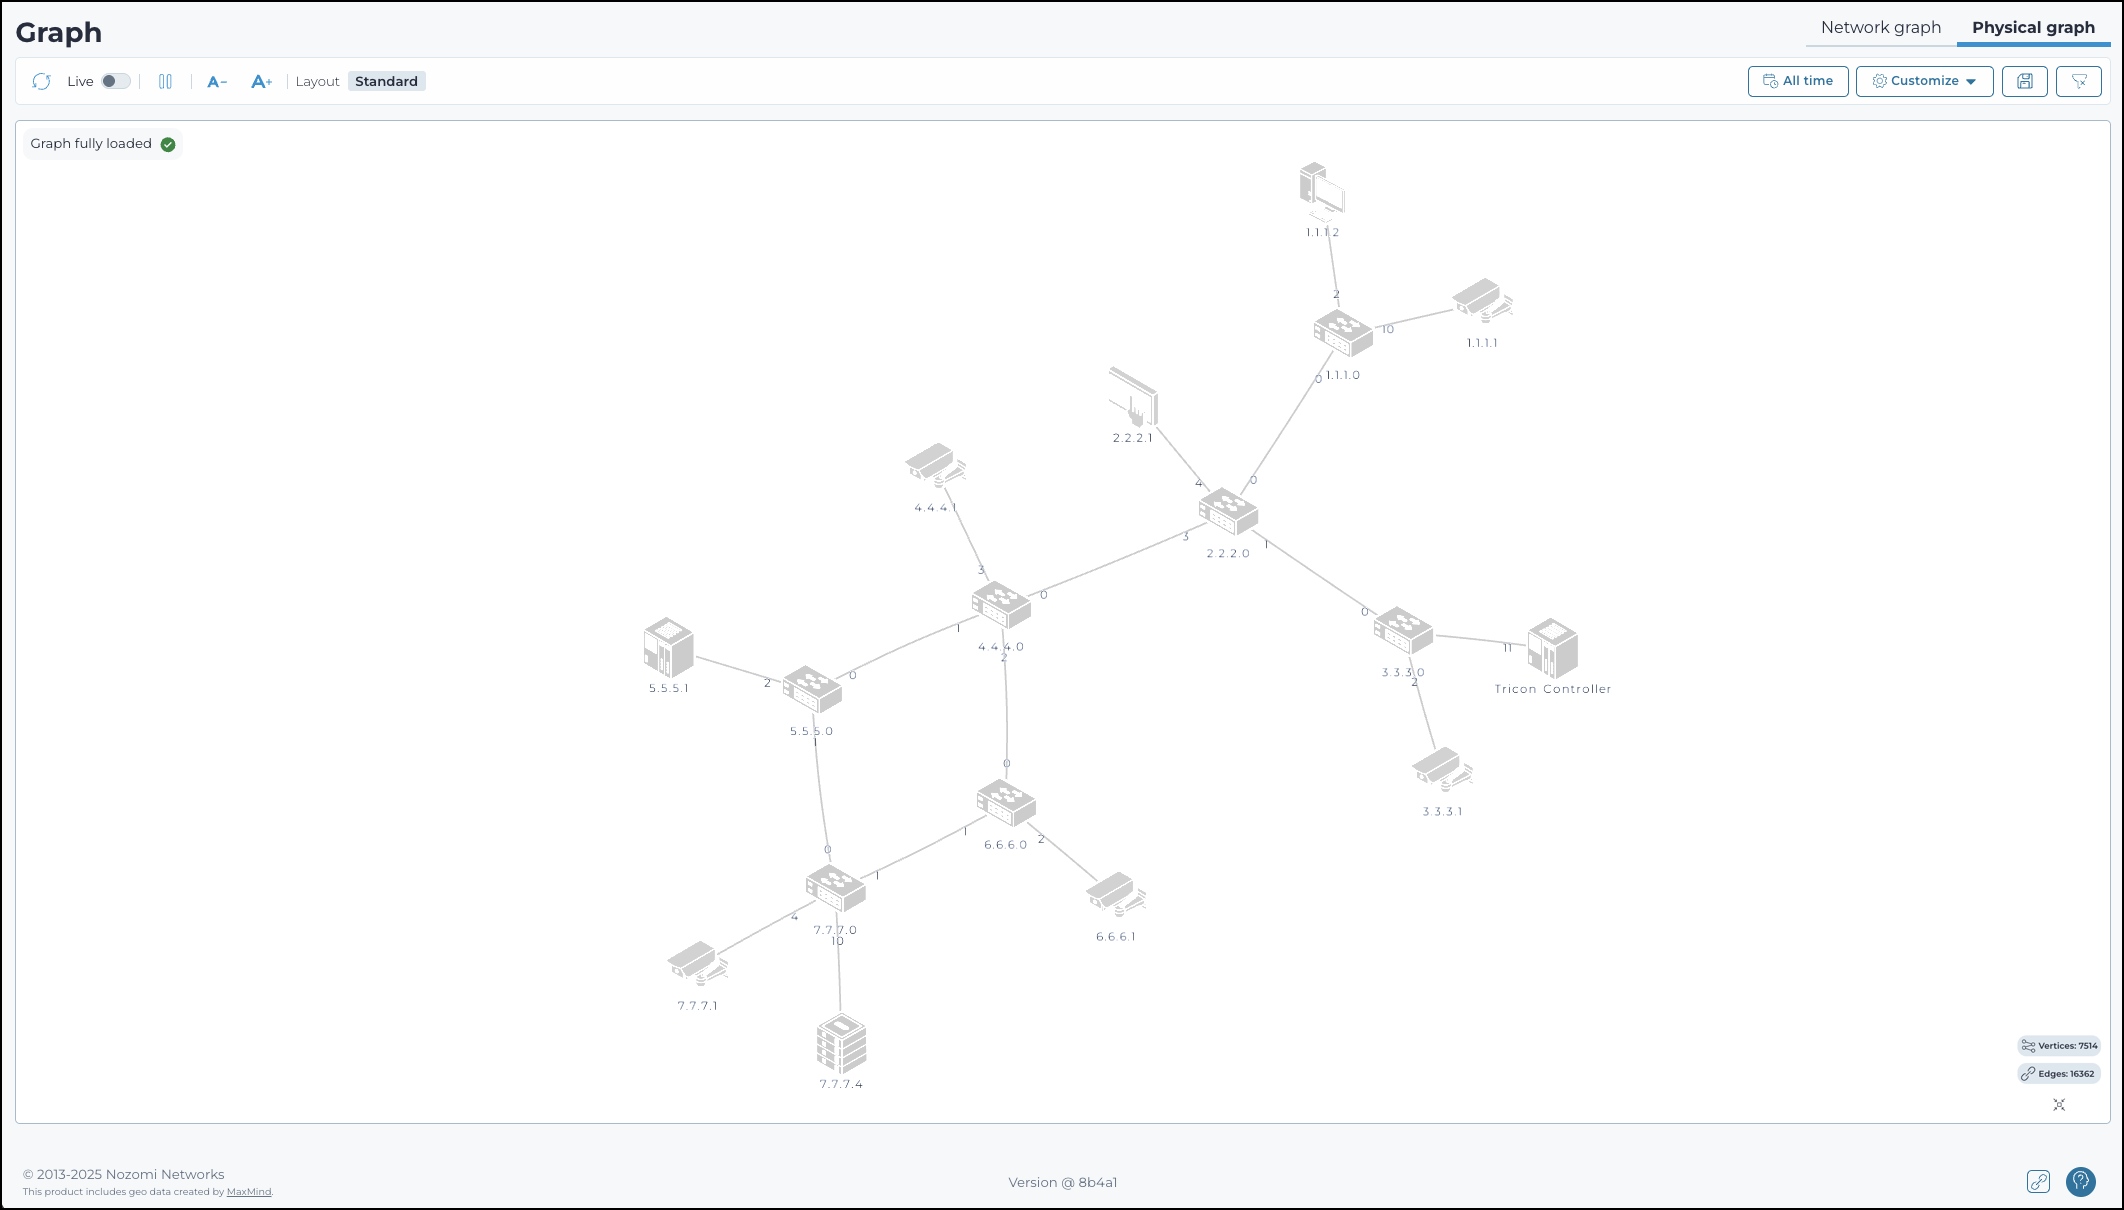
The Physical graph page displays a real-time interactive map of all physical device connections in the network. Nodes are shown only if a physical link has been detected for them. The graph, shows how devices connect at the cable level. It is a live, visual way to understand your physical network layout down to the port.
Overview
The Physical graph view provides a visual representation of cable-level connections between devices in the network. It uses data collected through Smart Polling and system integrations to display physical links in a dynamic topology graph that reflects actual hardware wiring, including switch port details.
This view supplements logical graphs by showing real-time or historical physical connectivity between assets. Devices are positioned based on link data, with visual indicators that show port assignments and device types. Use the Physical graph to examine network structure, trace physical paths, and identify connectivity changes.
Icons
Refresh
The Refresh
![]() icon lets you immediately refresh the current view.
icon lets you immediately refresh the current view.
Live
The Live
![]() toggle lets you change live view on, or off. When live
mode is on, the page will refresh periodically.
toggle lets you change live view on, or off. When live
mode is on, the page will refresh periodically.
Pause-play
The pause-play ![]() icon lets you pause, or restart the motion of the
graph.
icon lets you pause, or restart the motion of the
graph.
Layout
The Layout icon shows which layout is active in the graph. You can select from the available options in the Customize menu.
Icon size
These icons let you increase, or decrease the size of the icons.
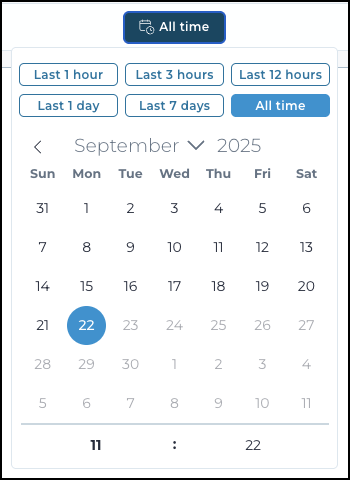
Time selector
Choose a time period for the graph.
Customize
The Customize button opens a menu of settings that you can choose from. For more details, see Graph customization.
Save
The save ![]() icon lets you save the current filter settings.
icon lets you save the current filter settings.
Clear filter
The clear filter ![]() icon lets you clear all the current filters.
icon lets you clear all the current filters.
Reset and center zoom
The reset and center zoom ![]() icon resets the zoom level and centers the graph.
icon resets the zoom level and centers the graph.
Graph navigation
- Use your cursor to zoom in and out
- Use your mouse to click-and-drag the graph and move it
- Select links (lines) and assets (icons) to view the related details in the right drawer
- In the drawer, you can select Details to open the related Vantage page