Bucket and history
An example of a query to calculate the distribution of link events towards an internet protocol (IP) address.
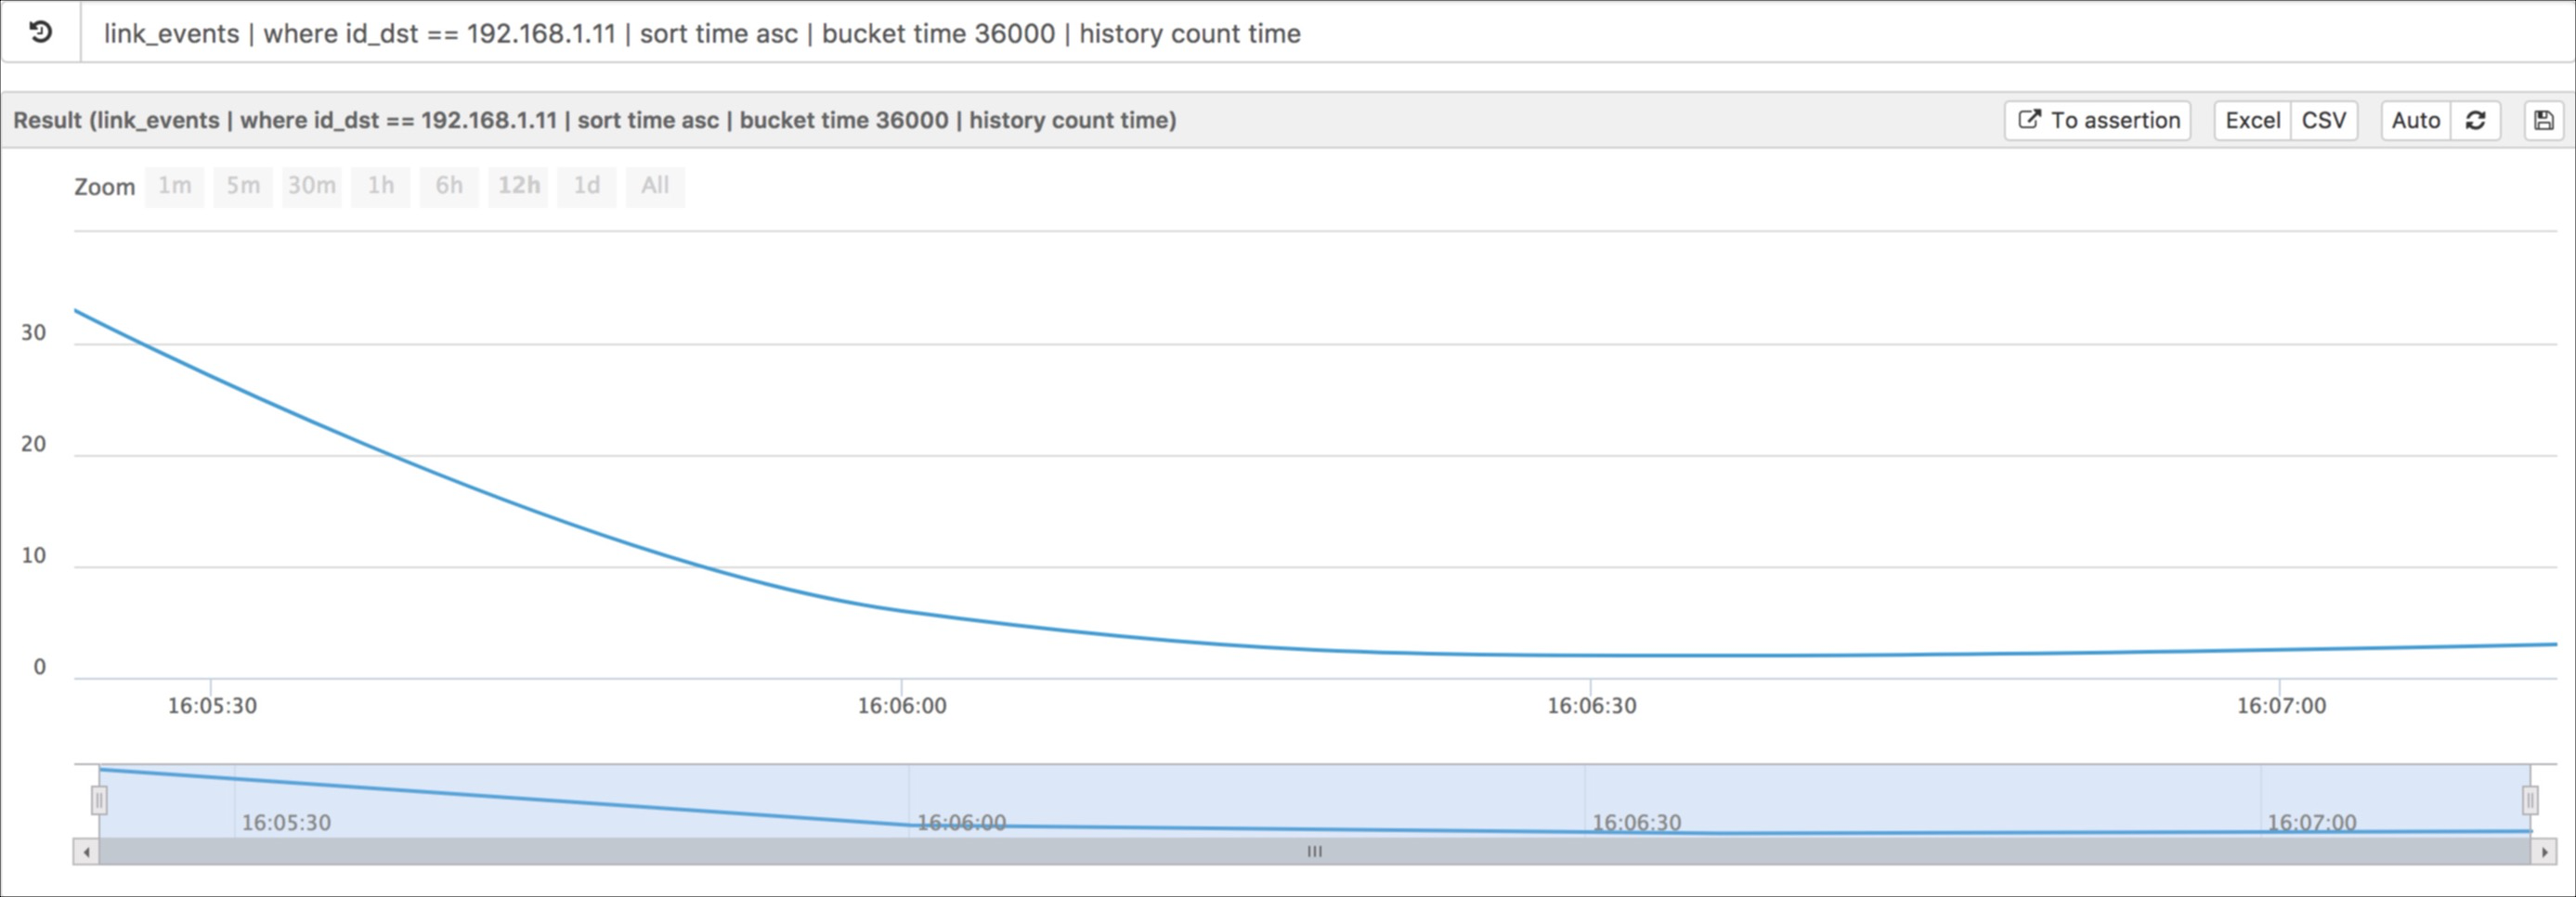
You can filter all the link_events with id_dst equal to
192.168.1.11 After this you can sort by time, this is a very
important step because bucket and history depend on how the data are sorted.
Then you can use buckethistory command to draw a chart, we pass
count as a value for the Y axis and time for the X
axis.
The history command is particularly suited for displaying a big amount
of data, in the image below we can see that there are many hours of data to analyze.
link_events | where id_dst == 192.168.1.11 | sort time asc | bucket time 36000 | history count time