Main network graph
The main network graph shows a graphical representation of the nodes in your environment.
 PDF
PDF
This icon lets you export a portable document format (PDF) report which contains the graph, as it is currently shown on the page.
?
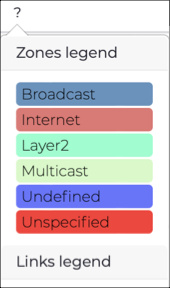
 Filters
This indicates active graph filtering, when present. Filters can be from the filter bar (see R and S below), or activated from the zone/topology graph when you select a link/node in the zone/topology graphs. Once a filter is enabled with a value, the graph is automatically updated. If more than one filter is enabled, then a logical and criteria is applied. Only nodes that satisfy all of the specified filters are shown.
Reset
This resets customizations and reloads the data.
Live / refresh
The Live
![]()
![]() icon lets you change live view on, or off. When live
mode is on, the page will refresh approximately every five seconds.
icon lets you change live view on, or off. When live
mode is on, the page will refresh approximately every five seconds.
Time
For more details, Magic wand.
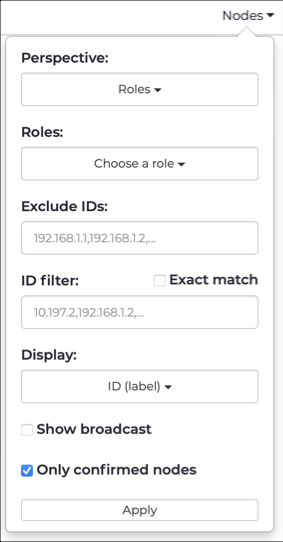
Nodes
This dropdown lets you select node visualization configuration options.
Links
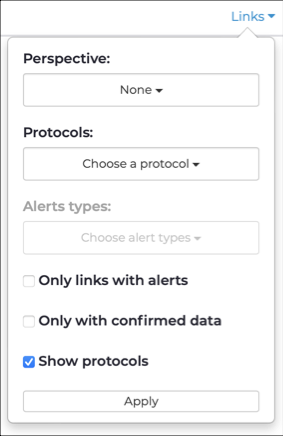
This dropdown lets you configure visualization options.
Layout
This dropdown lets you select a layout for the graph. For more details, see Layout.
Pause-play
The pause-play ![]() icon lets you pause, or restart the motion of the
graph.
icon lets you pause, or restart the motion of the
graph.
Increase-Decrease icon size
The increase ![]() and decrease
and decrease ![]() icons lets you change the size of the icons in the graph.
icons lets you change the size of the icons in the graph.