Zones/Topology graph
The Zones/Topology graph shows a visualization of the network topology or zones.
General
You can see a visualization of either the zones or the topology, but not both at the same time. You can control these views with the two toggle buttons.
Inside the Zones graph, each node represents a zone and each link represents all of the links between the nodes in the connected zones. When you select a zone, the information pane is populated with all of the nodes/links that are related to the selected zone. The main network graph is filtered to show only the nodes and the links for that zone, and the filtering icon shows.
In a similar way, when a link is selected in the Zones graph, the information pane is populated with all of the links between the two zones, and the Networks graph shows only the nodes and links that belong to one of the two connected zones. When you click in a region of the Zones graph that has no nodes or links, the visualization in the main networks graph is reset to show all the nodes and links.
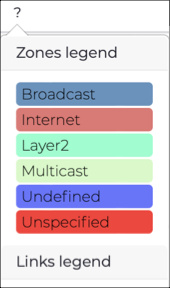
Zones legend
Time
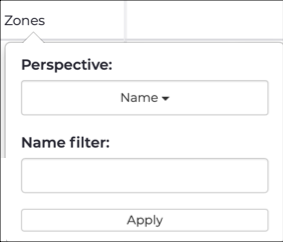
Zones
Links
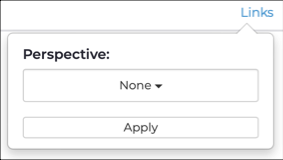
This dropdown lets you configure visualization options.