Column chart
An example on how to create a column chart with the top nodes by traffic.
To start, you need to get the nodes and select the:
idsent.bytesreceived.bytessent.bytesreceived.bytes
sum function. The
query
is:nodes | select id sent.bytes received.bytes sum(sent.bytes,received.bytes)When you execute this query, the sum field has a very long name. You can rename it to be more comfortable with these commands:
nodes | select id sent.bytes received.bytes sum(sent.bytes,received.bytes)->sumTo obtain the top nodes by traffic, you can sort and take the first
10:
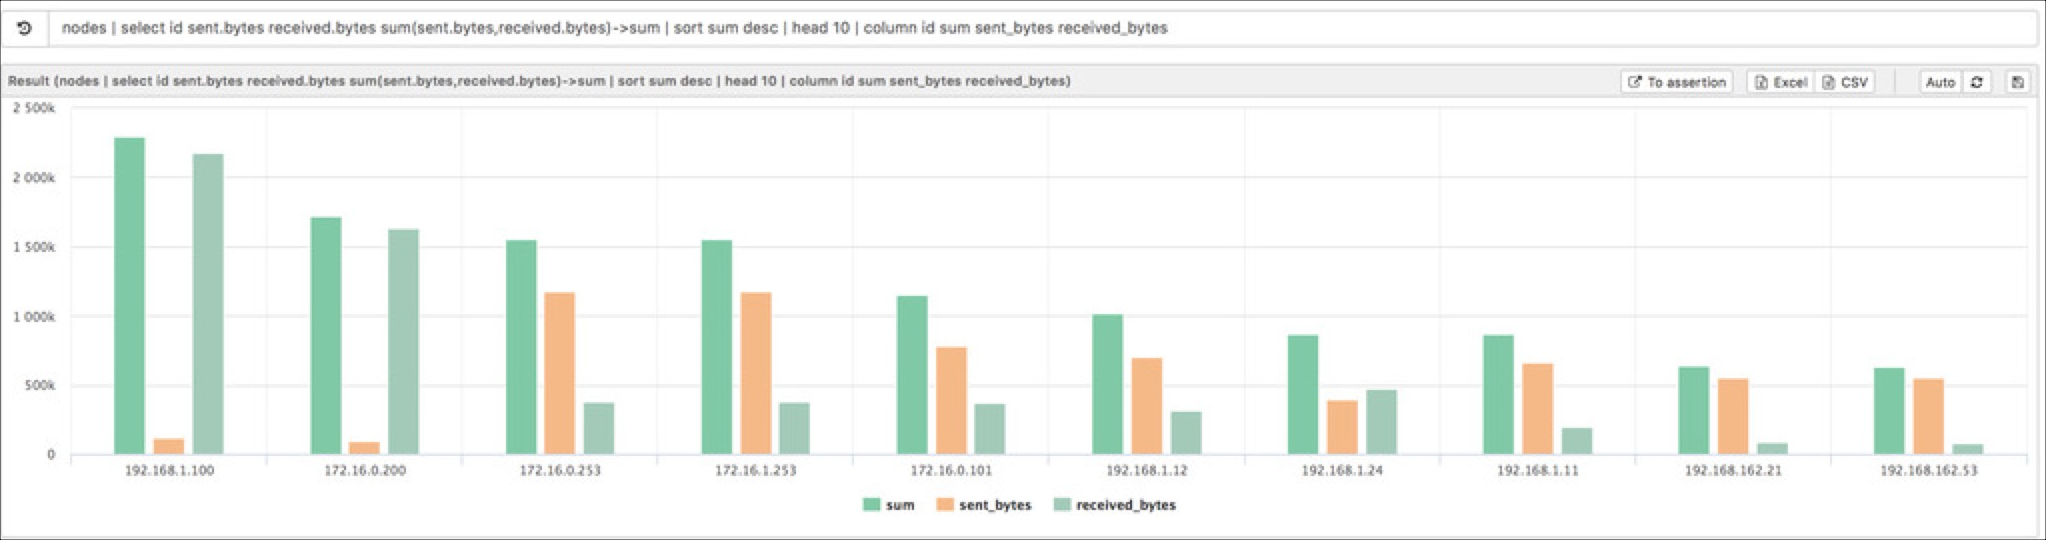
nodes | select id sent.bytes received.bytes sum(sent.bytes,received.bytes)->sum | sort sum desc | head 10Finally, to display the data in a graphical way, you can use the
column
command:nodes | select id sent.bytes received.bytes sum(sent.bytes,received.bytes)->sum | sort sum desc | head 10 | column id sum sent_bytes received_bytesNote:
You can access an inner field of a complex type with the dot
syntax, in the example the dot syntax is used on the fields
sent and
received to access their bytes sub field.Note:
After accessing a field with the dot syntax, it will gain a new
name to avoid ambiguity; the dot is replaced by an underscore. In the example
sent.bytes become sent_bytes