Dashboards
The Dashboards page lets you create and configure widget-based dashboards that provide information about your network. The dashboards created here will show on the Guardian home page, and give an overview of the monitored environment.
| Widget | Description |
|---|---|
| Environment information | This provides a high level view of your network, in terms of the number of assets, nodes, links, protocols and variables |
| Asset overview | Assets, grouped by Purdue level |
| Alert flow over time | Alert risk charted over time |
| Latest alerts | Latest alerts (the most recent being first) |
| Failed assertions | List of failed assertions |
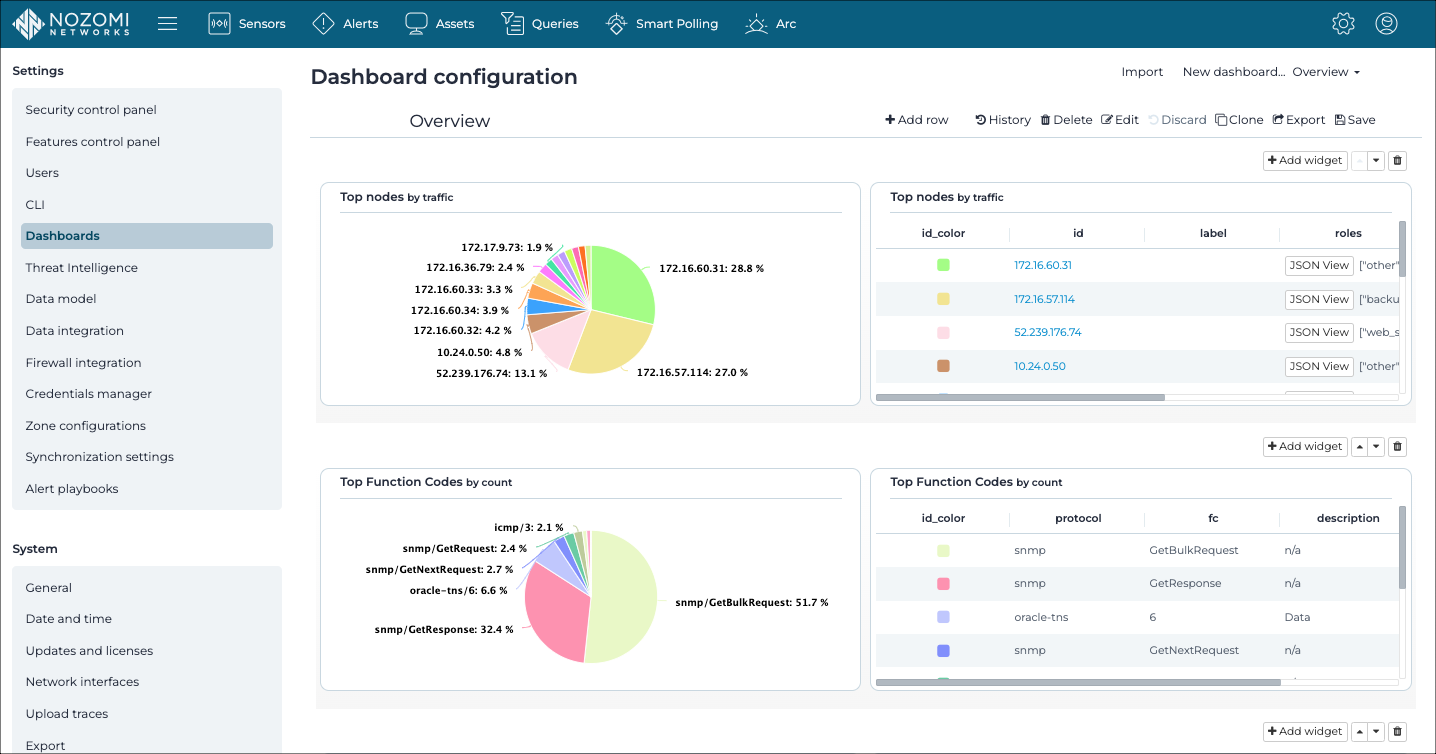
Import
This lets you Import a dashboard.
New dashboard
This lets you Create a dashboard.
Dashboard selector
This dropdown lets you select from dashboards that already exist.
+ Add row
This lets you add a new row to the dashboard.
History
This lets you revert to a previous version of the dashboard.
Delete
This lets you delete the current dashboard.
Edit
This lets you edit the name and the group of users who can see this dashboard when they log in to the Central Management Console (CMC).
Discard
This lets you discard the change that you have made to the dashboard.
Clone
This lets you clone the current dashboard to make a new one.
Export
This lets you export the current dashboard in JavaScript Object Notation (JSON) format.
Save
This lets you save the changes.
+ Add widget
This lets you add one, or more, widgets to the dashboard, that you can then configure.