Physical
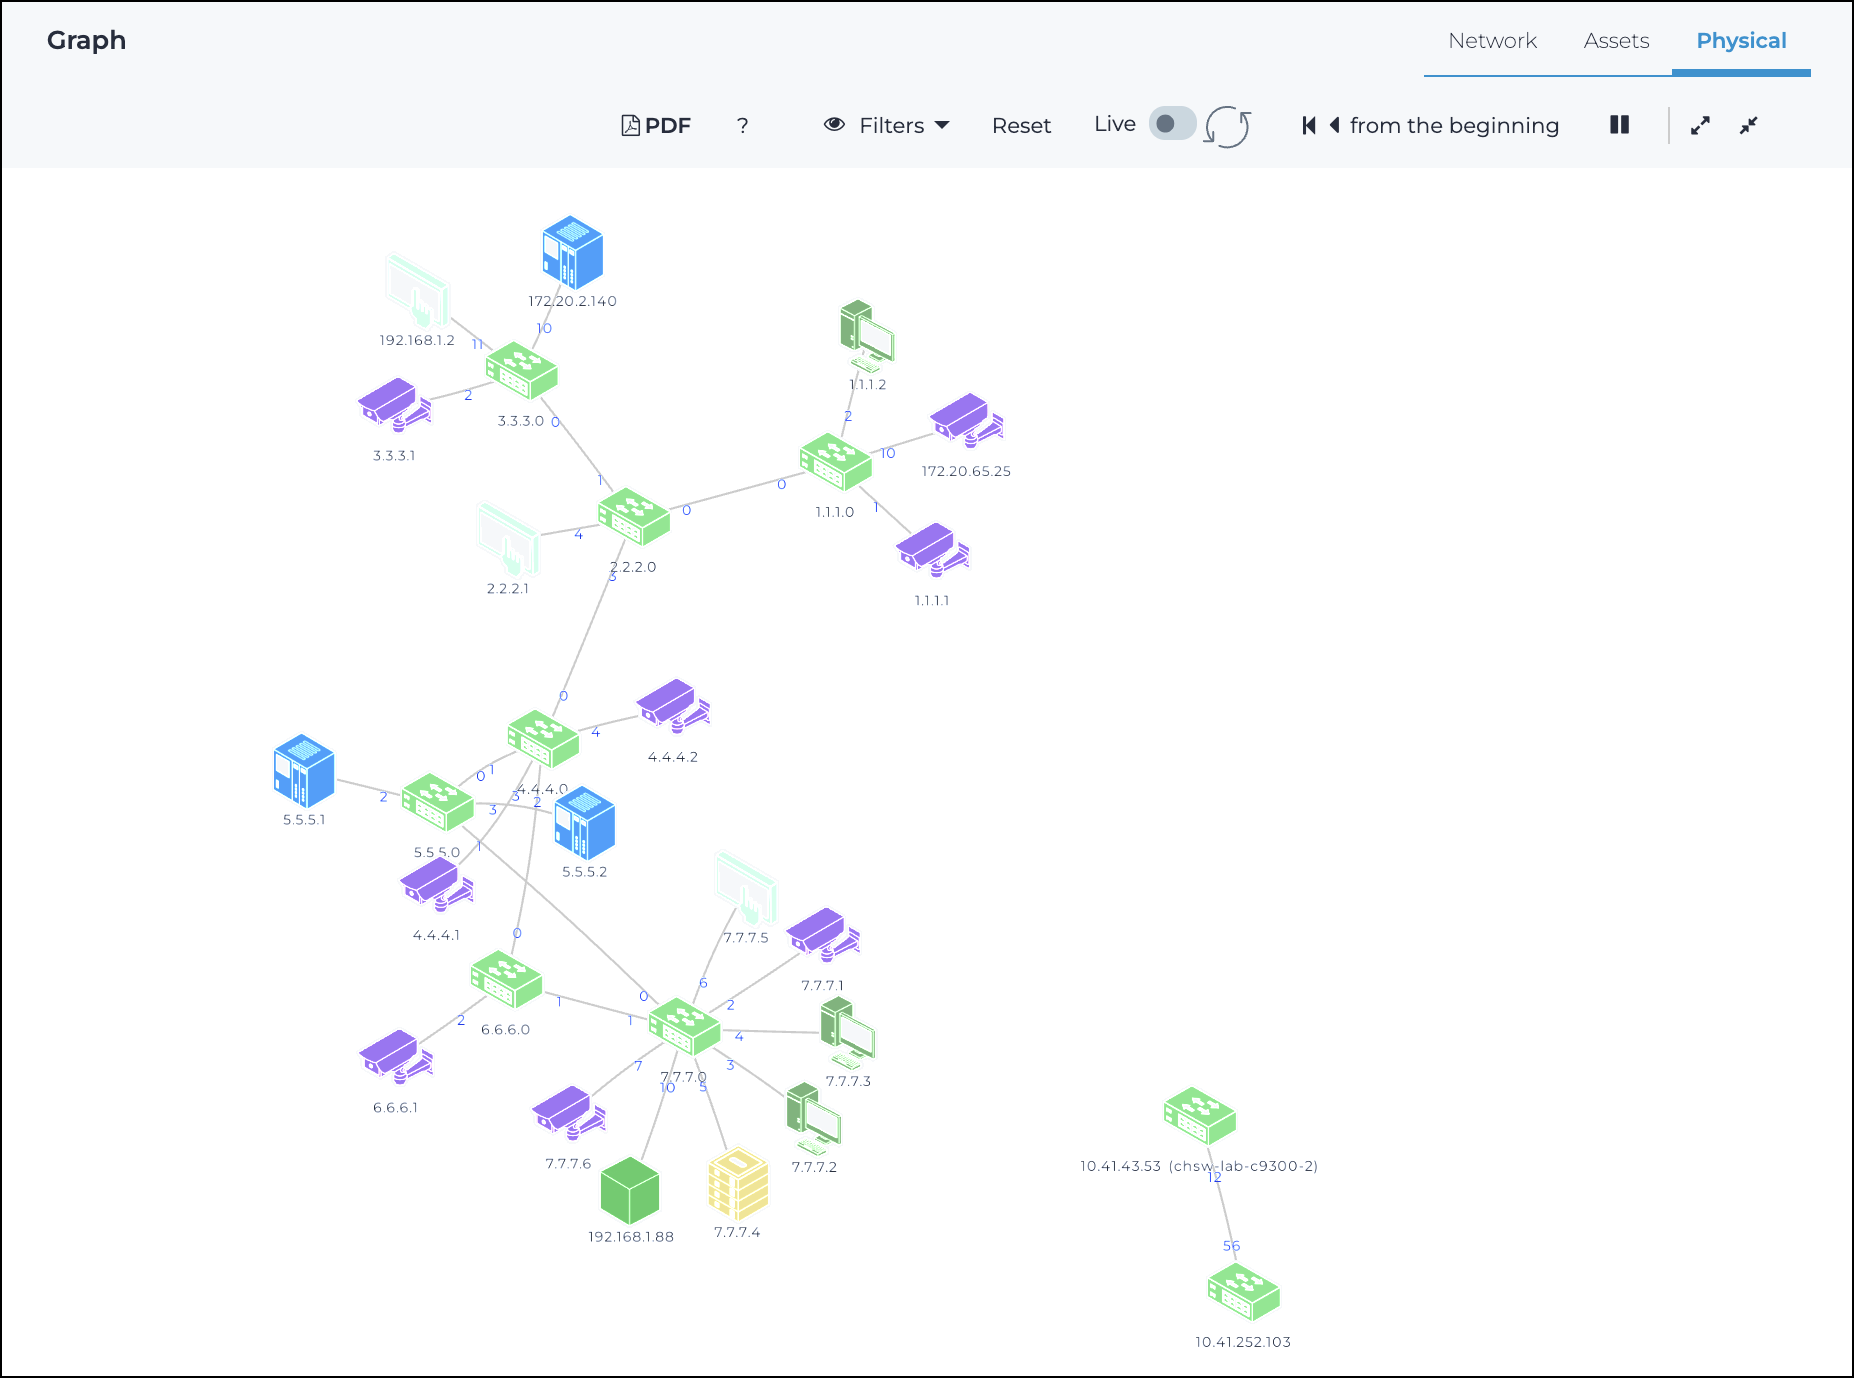
The Physical page displays a real-time interactive map of all physical device connections in the network. Nodes are shown only if a physical link has been detected for them. The graph, shows how devices connect at the cable level. It is a live, visual way to understand your physical network layout down to the port.
Overview
The Physical graph view provides a visual representation of cable-level connections between devices in the network. It uses data collected through Smart Polling and system integrations to display physical links in a dynamic topology graph that reflects actual hardware wiring, including switch port details.
This view supplements logical graphs by showing real-time or historical physical connectivity between assets. Devices are positioned based on link data, with visual indicators that show port assignments and device types. Use the Physical graph to examine network structure, trace physical paths, and identify connectivity changes.
Generate PDF report
The generate PDF ![]() icon lets you create a portable document format (PDF)
report of the selected item, which will show in the Reports
page when it is ready.
icon lets you create a portable document format (PDF)
report of the selected item, which will show in the Reports
page when it is ready.
 Filters
This indicates active graph filtering, when present. Filters can be from the filter bar (see R and S below), or activated from the zone/topology graph when you select a link/node in the zone/topology graphs. Once a filter is enabled with a value, the graph is automatically updated. If more than one filter is enabled, then a logical and criteria is applied. Only nodes that satisfy all of the specified filters are shown.
Reset
This resets customizations and reloads the data.
Live / refresh
The Live
![]()
![]() icon lets you change live view on, or off. When live
mode is on, the page will refresh approximately every five seconds.
icon lets you change live view on, or off. When live
mode is on, the page will refresh approximately every five seconds.
Time
For more details, Magic wand.
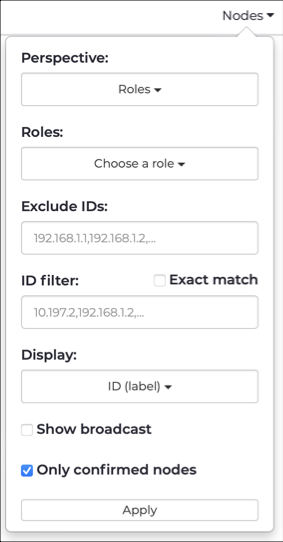
Nodes
This dropdown lets you select node visualization configuration options.
Links
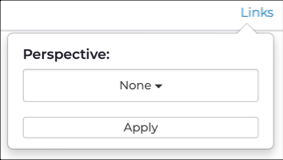
This dropdown lets you configure visualization options.
Layout
This dropdown lets you select a layout for the graph. For more details, see Layout.
Play-pause
The play-pause ![]() icon lets you pause, or restart the motion of the
graph.
icon lets you pause, or restart the motion of the
graph.
Increase-Decrease icon size
The increase ![]() and decrease
and decrease ![]() icons lets you change the
size of the icons in the graph.
icons lets you change the
size of the icons in the graph.