Assets
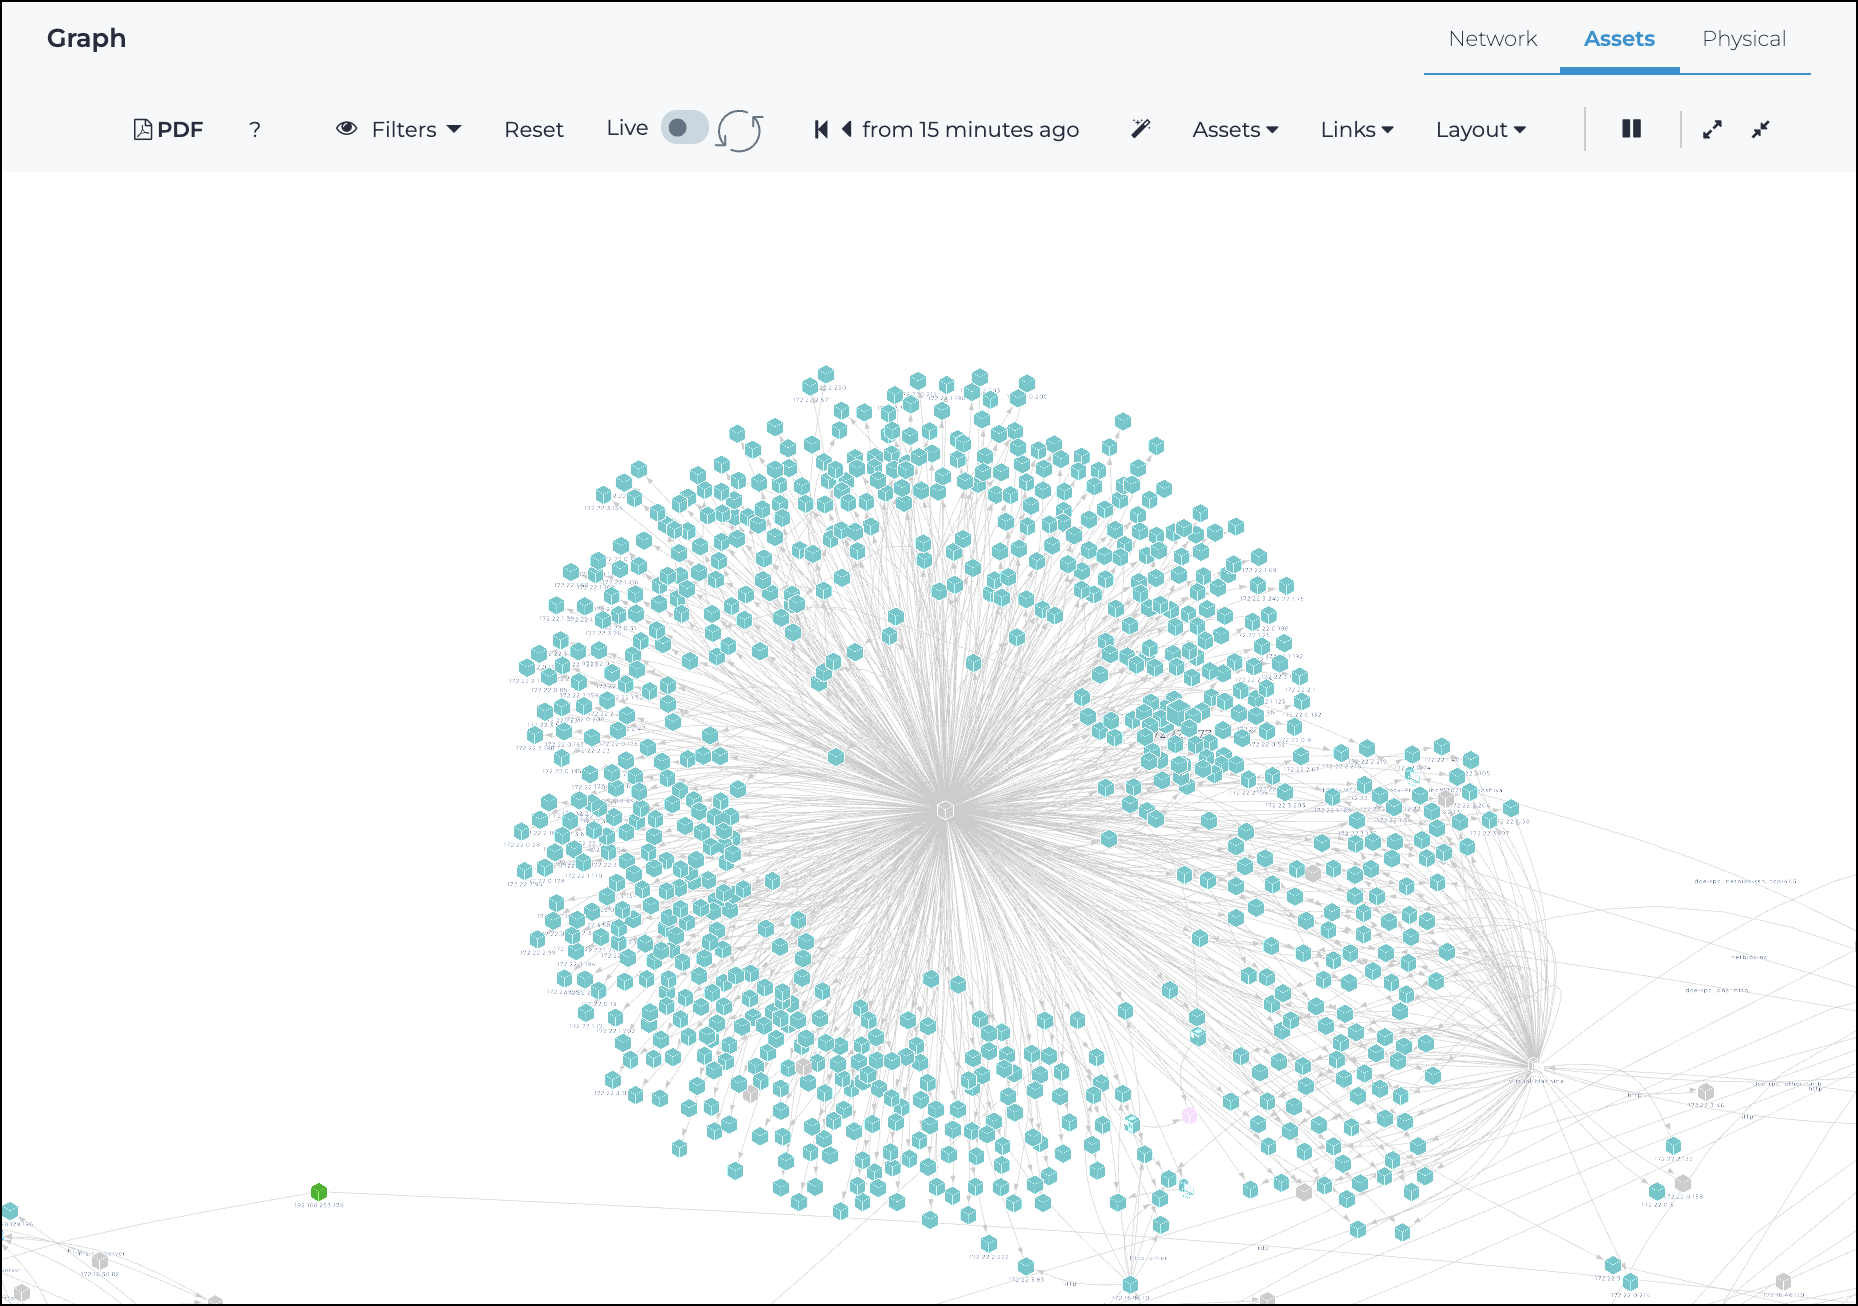
The Assets page shows linked assets as graph vertices when available, and defaults to node display when no asset is associated. This view provides a contextual representation of asset relationships within the network topology.
Overview
The asset graph groups nodes by asset when possible, unlike the standard network graph. For example, if an asset includes two nodes, the network graph displays two separate icons, one for each node, while the asset graph displays a single icon that represents the asset.
In the case that a node does not belong to an asset then the asset graph shows the node itself.
Generate PDF report
The generate PDF ![]() icon lets you create a portable document format (PDF)
report of the selected item, which will show in the Reports
page when it is ready.
icon lets you create a portable document format (PDF)
report of the selected item, which will show in the Reports
page when it is ready.
 Filters
This indicates active graph filtering, when present. Filters can be from the filter bar (see R and S below), or activated from the zone/topology graph when you select a link/node in the zone/topology graphs. Once a filter is enabled with a value, the graph is automatically updated. If more than one filter is enabled, then a logical and criteria is applied. Only nodes that satisfy all of the specified filters are shown.
Reset
This resets customizations and reloads the data.
Live / refresh
The Live
![]()
![]() icon lets you change live view on, or off. When live
mode is on, the page will refresh approximately every five seconds.
icon lets you change live view on, or off. When live
mode is on, the page will refresh approximately every five seconds.
Time
For more details, Magic wand.
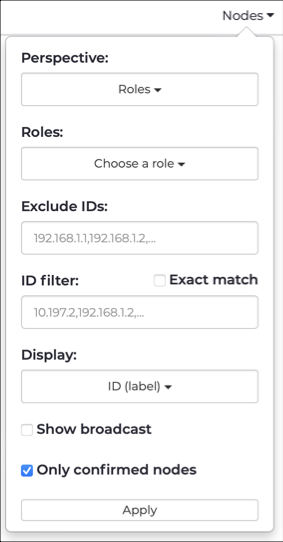
Nodes
This dropdown lets you select node visualization configuration options.
Links
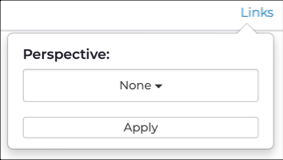
This dropdown lets you configure visualization options.
Layout
This dropdown lets you select a layout for the graph. For more details, see Layout.
Play-pause
The play-pause ![]() icon lets you pause, or restart the motion of the
graph.
icon lets you pause, or restart the motion of the
graph.
Increase-Decrease icon size
The increase ![]() and decrease
and decrease ![]() icons lets you change the
size of the icons in the graph.
icons lets you change the
size of the icons in the graph.