Map
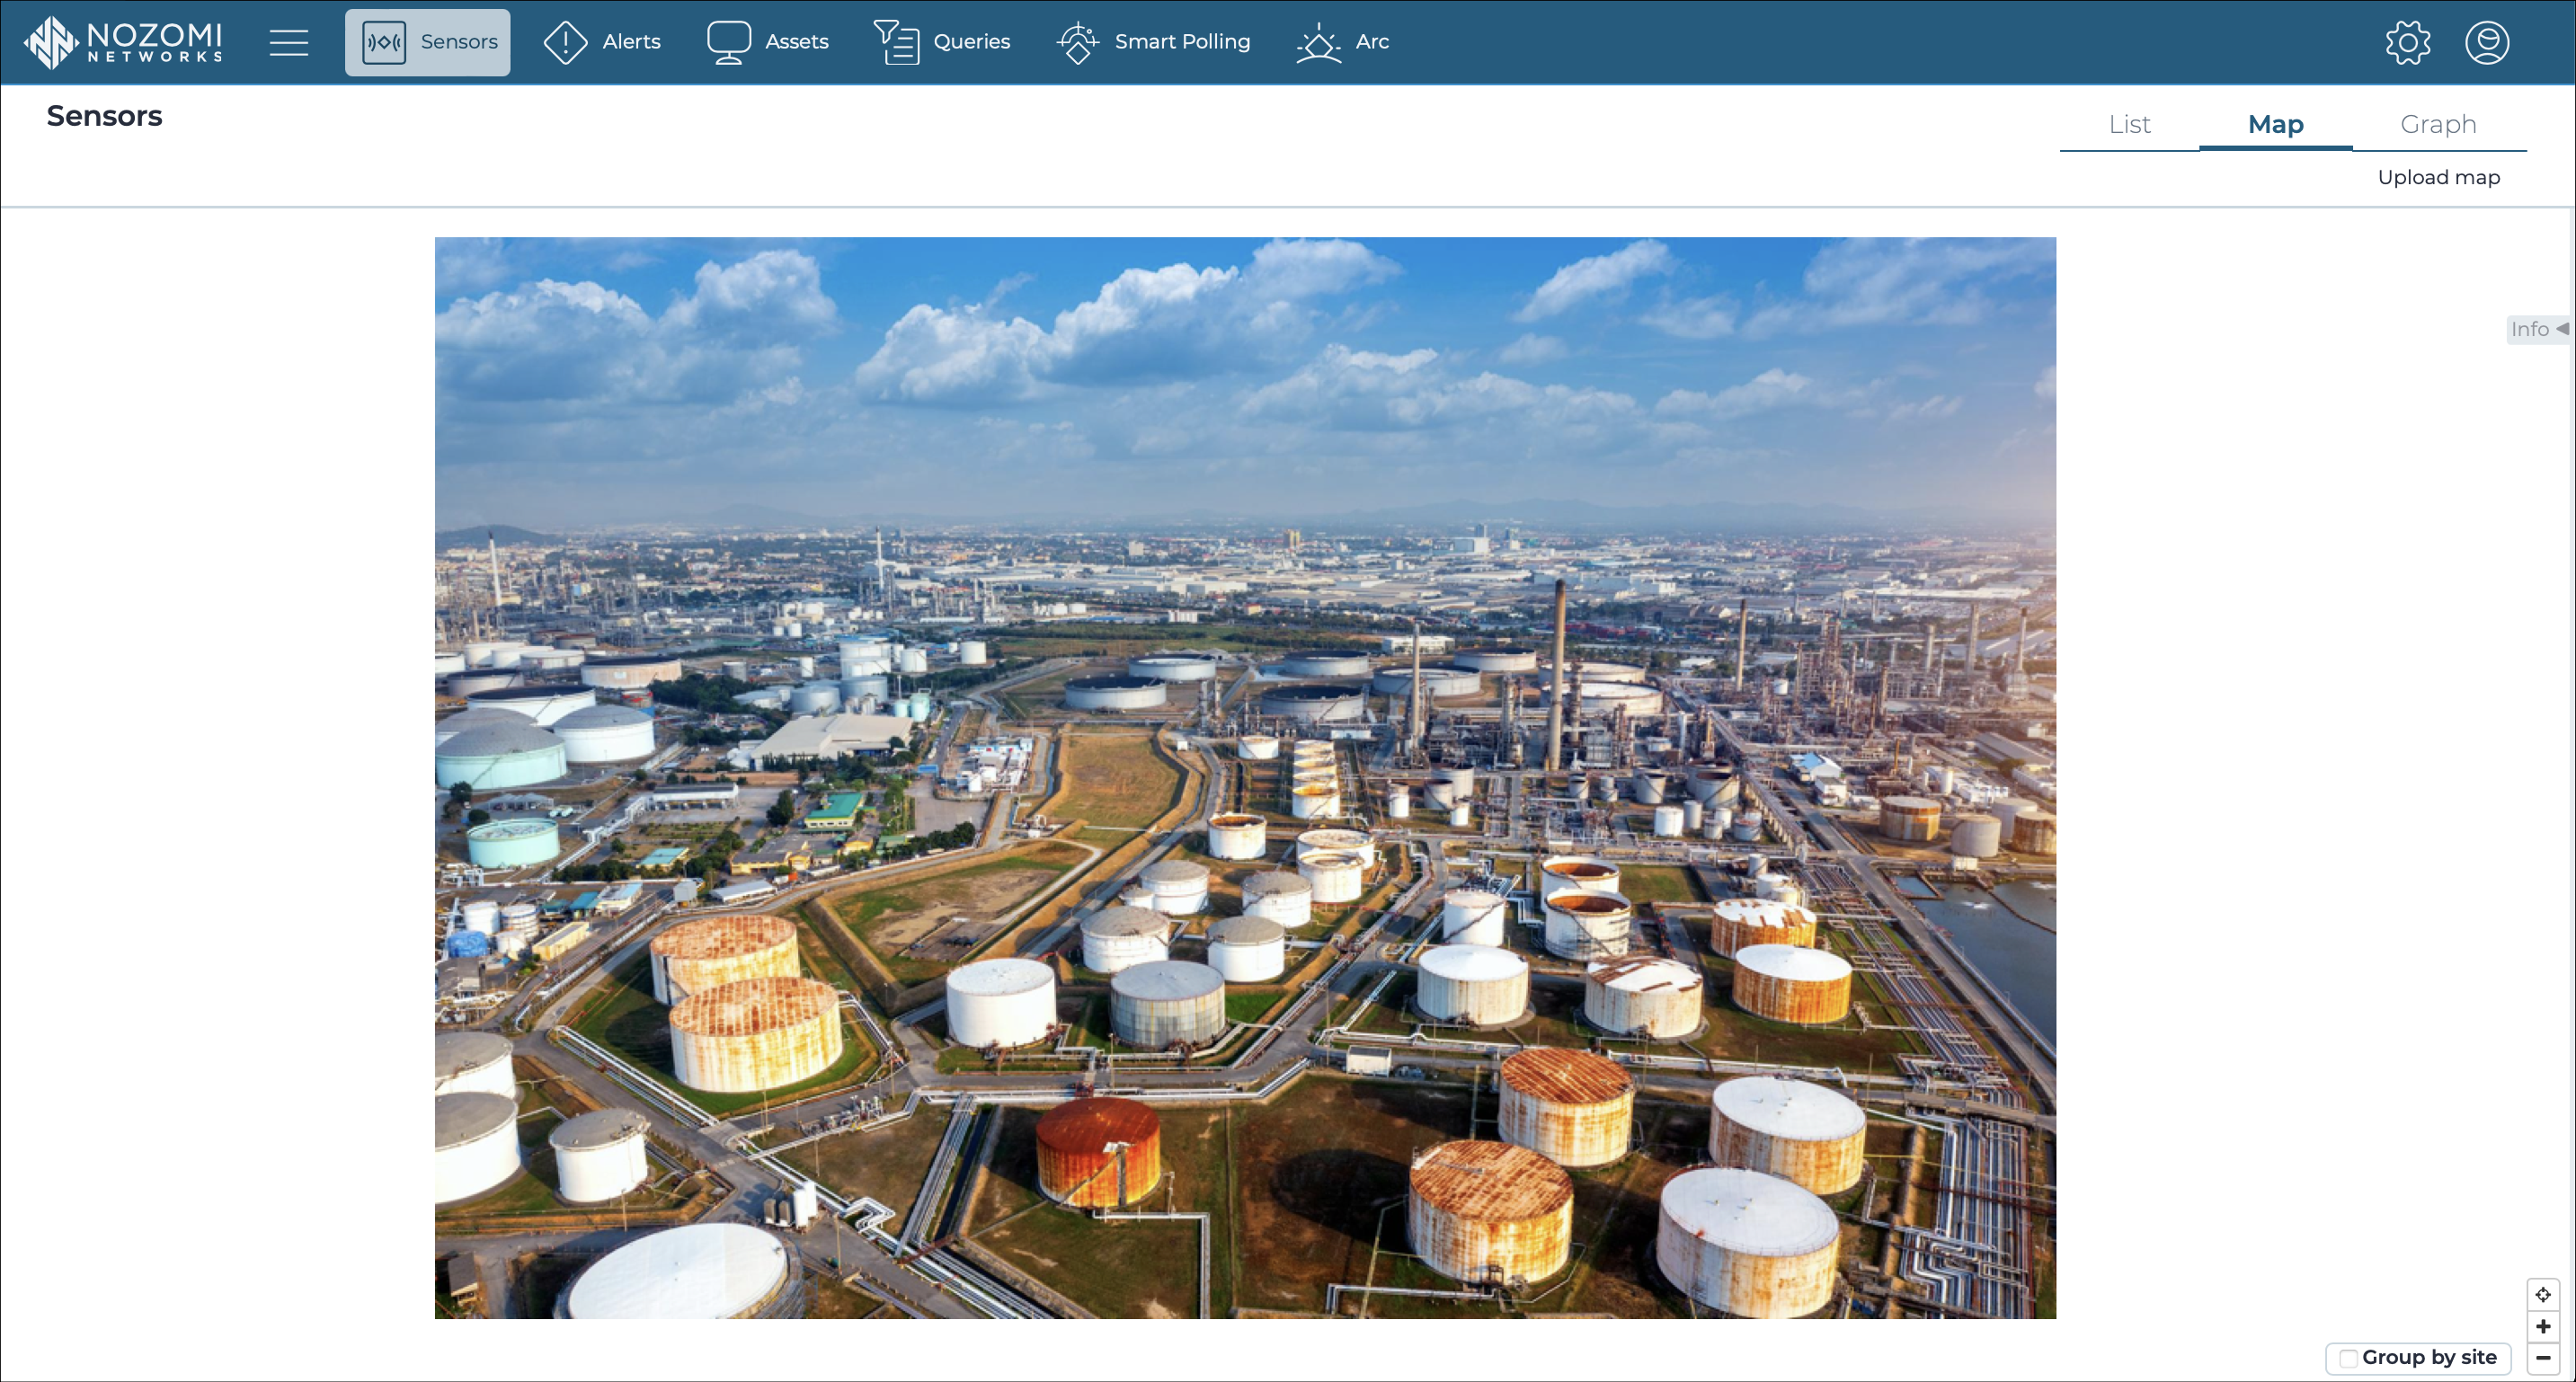
You can use the Map page to upload, and view, a map of the sensors in your environment.
Info(rmation) pane
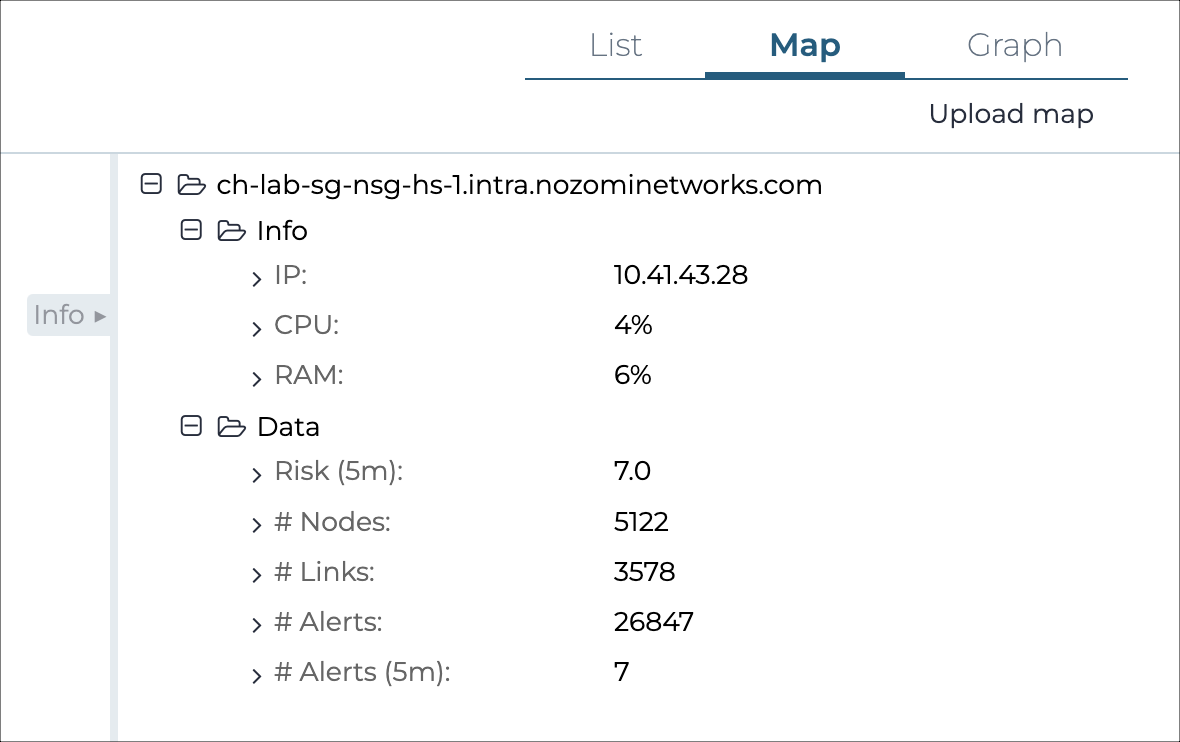
The Info pane lets you view information for the related sensor. The identifier (ID) of each sensor is used in the map to help you identify it. The marker color of the sensor relates to the risk of its alerts.
In the map view, a red indicator to the right of the sensor's ID shows the number of the alerts in the last five minutes. This indicator only shows if there are some alerts for the sensor. If the alerts in last 5 minutes increase, the sensor marker will blink for one minute.
If the site of the sensor has been specified in ![]() > System > General, it is possible to enable the Group by site
option, in the bottom right corner of the map view. The sensors with the same site
will be grouped to deliver a simpler view of a complex installation.
> System > General, it is possible to enable the Group by site
option, in the bottom right corner of the map view. The sensors with the same site
will be grouped to deliver a simpler view of a complex installation.