Insights
The Insights page shows a dynamic summary of all the insights for your organization. The table shows a row for each insight, which relates to items within the environment that need to be addressed. Severity level and last trigger time determine the sort order.
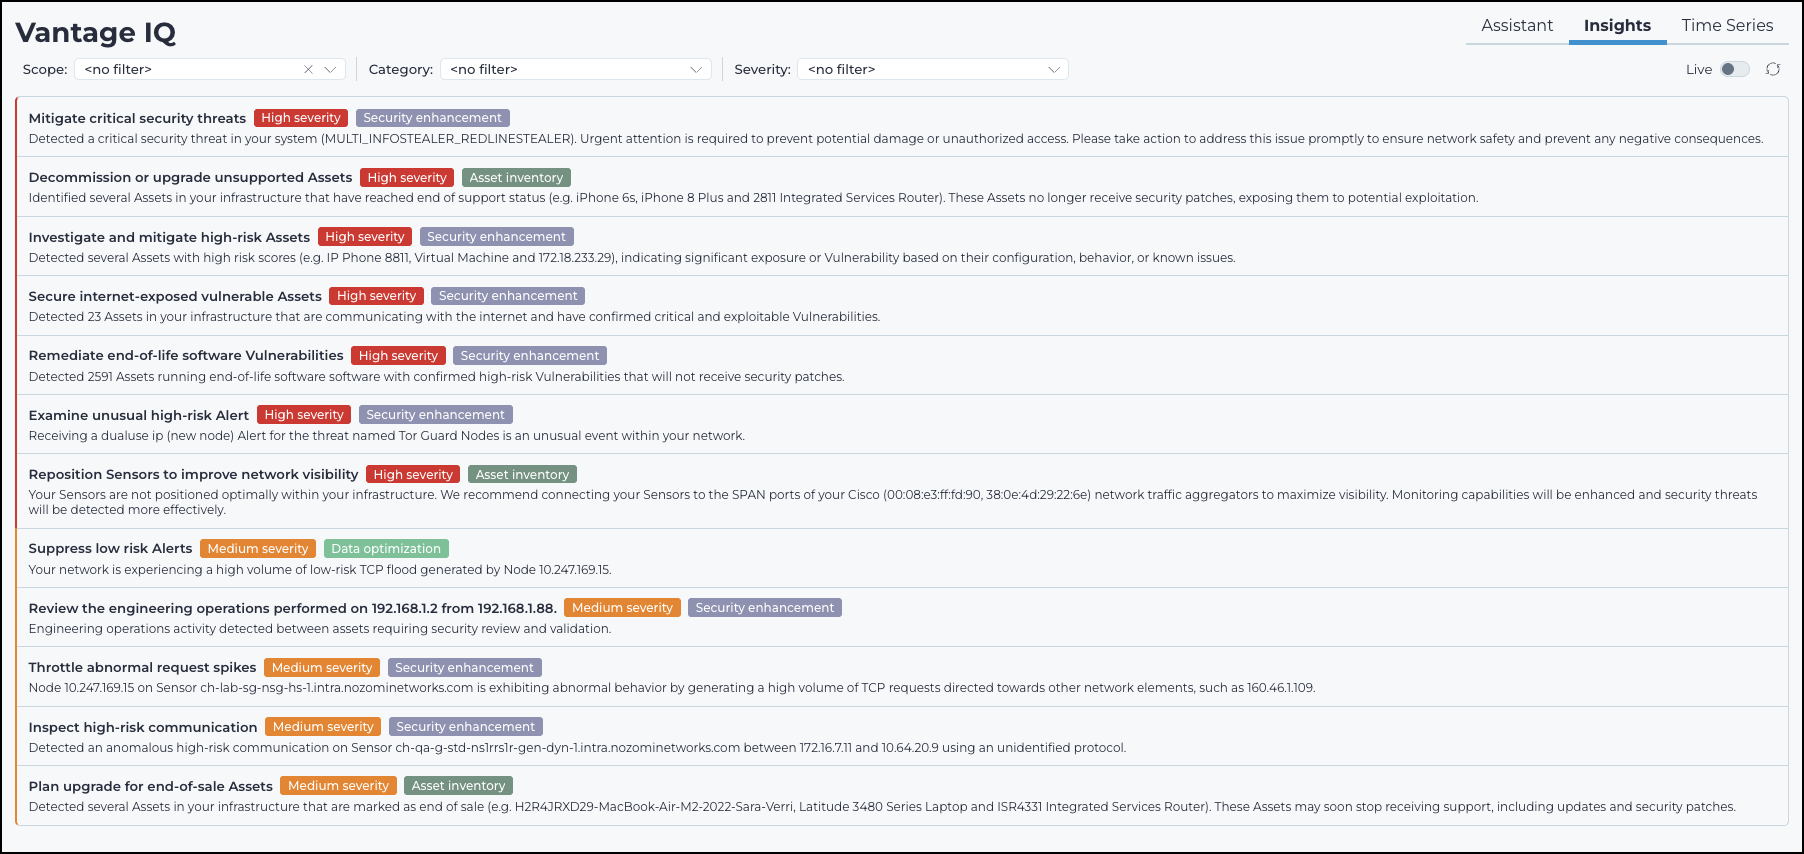
The Insights page shows correlated alerts and root-cause analysis. Vantage IQ uses deep neural networks to identify network activity patterns. Integrating data across Vantage makes it easier to:
- Analyze data forensically
- Tune settings
- Enhance security
A deeper understanding of security data and network traffic can help prioritize remediation efforts and close security gaps.
Filters
To filter the table view, there are these three dropdowns at the top of the page:
- Scope: This lets you use sites to limit the scope
- Category: This lets you use the insight category to filter the results
- Severity: This lets you use the insight severity level to filter the results
Severity levels
High severity
You should investigate this type of insight as soon as possible. The majority of critical insights relate to security issues.
Medium severity
This type of insight has security and operational concerns. The majority of warning insights are alerting improvements.
Low severity
This type of insight does not require immediate action. Informational insights help you understand your environment better.
The order the insights are shown in the list is:
- The most recent High severity insights show first, older High severity insights appear next
- The most recent Medium severity insights show next, older Medium severity insights appear next
- The most recent Low severity insights show next, older Low severity insights appear next
Table rows
You can select the table row of the insight to show a more detailed description of the insight. This lets you explore the insight further in the Details list of the related page.