Performance
The Performance page has graphical sections that show percentage usage for central processing unit (CPU), random-access memory (RAM), and disk usage. It also has a Services section.
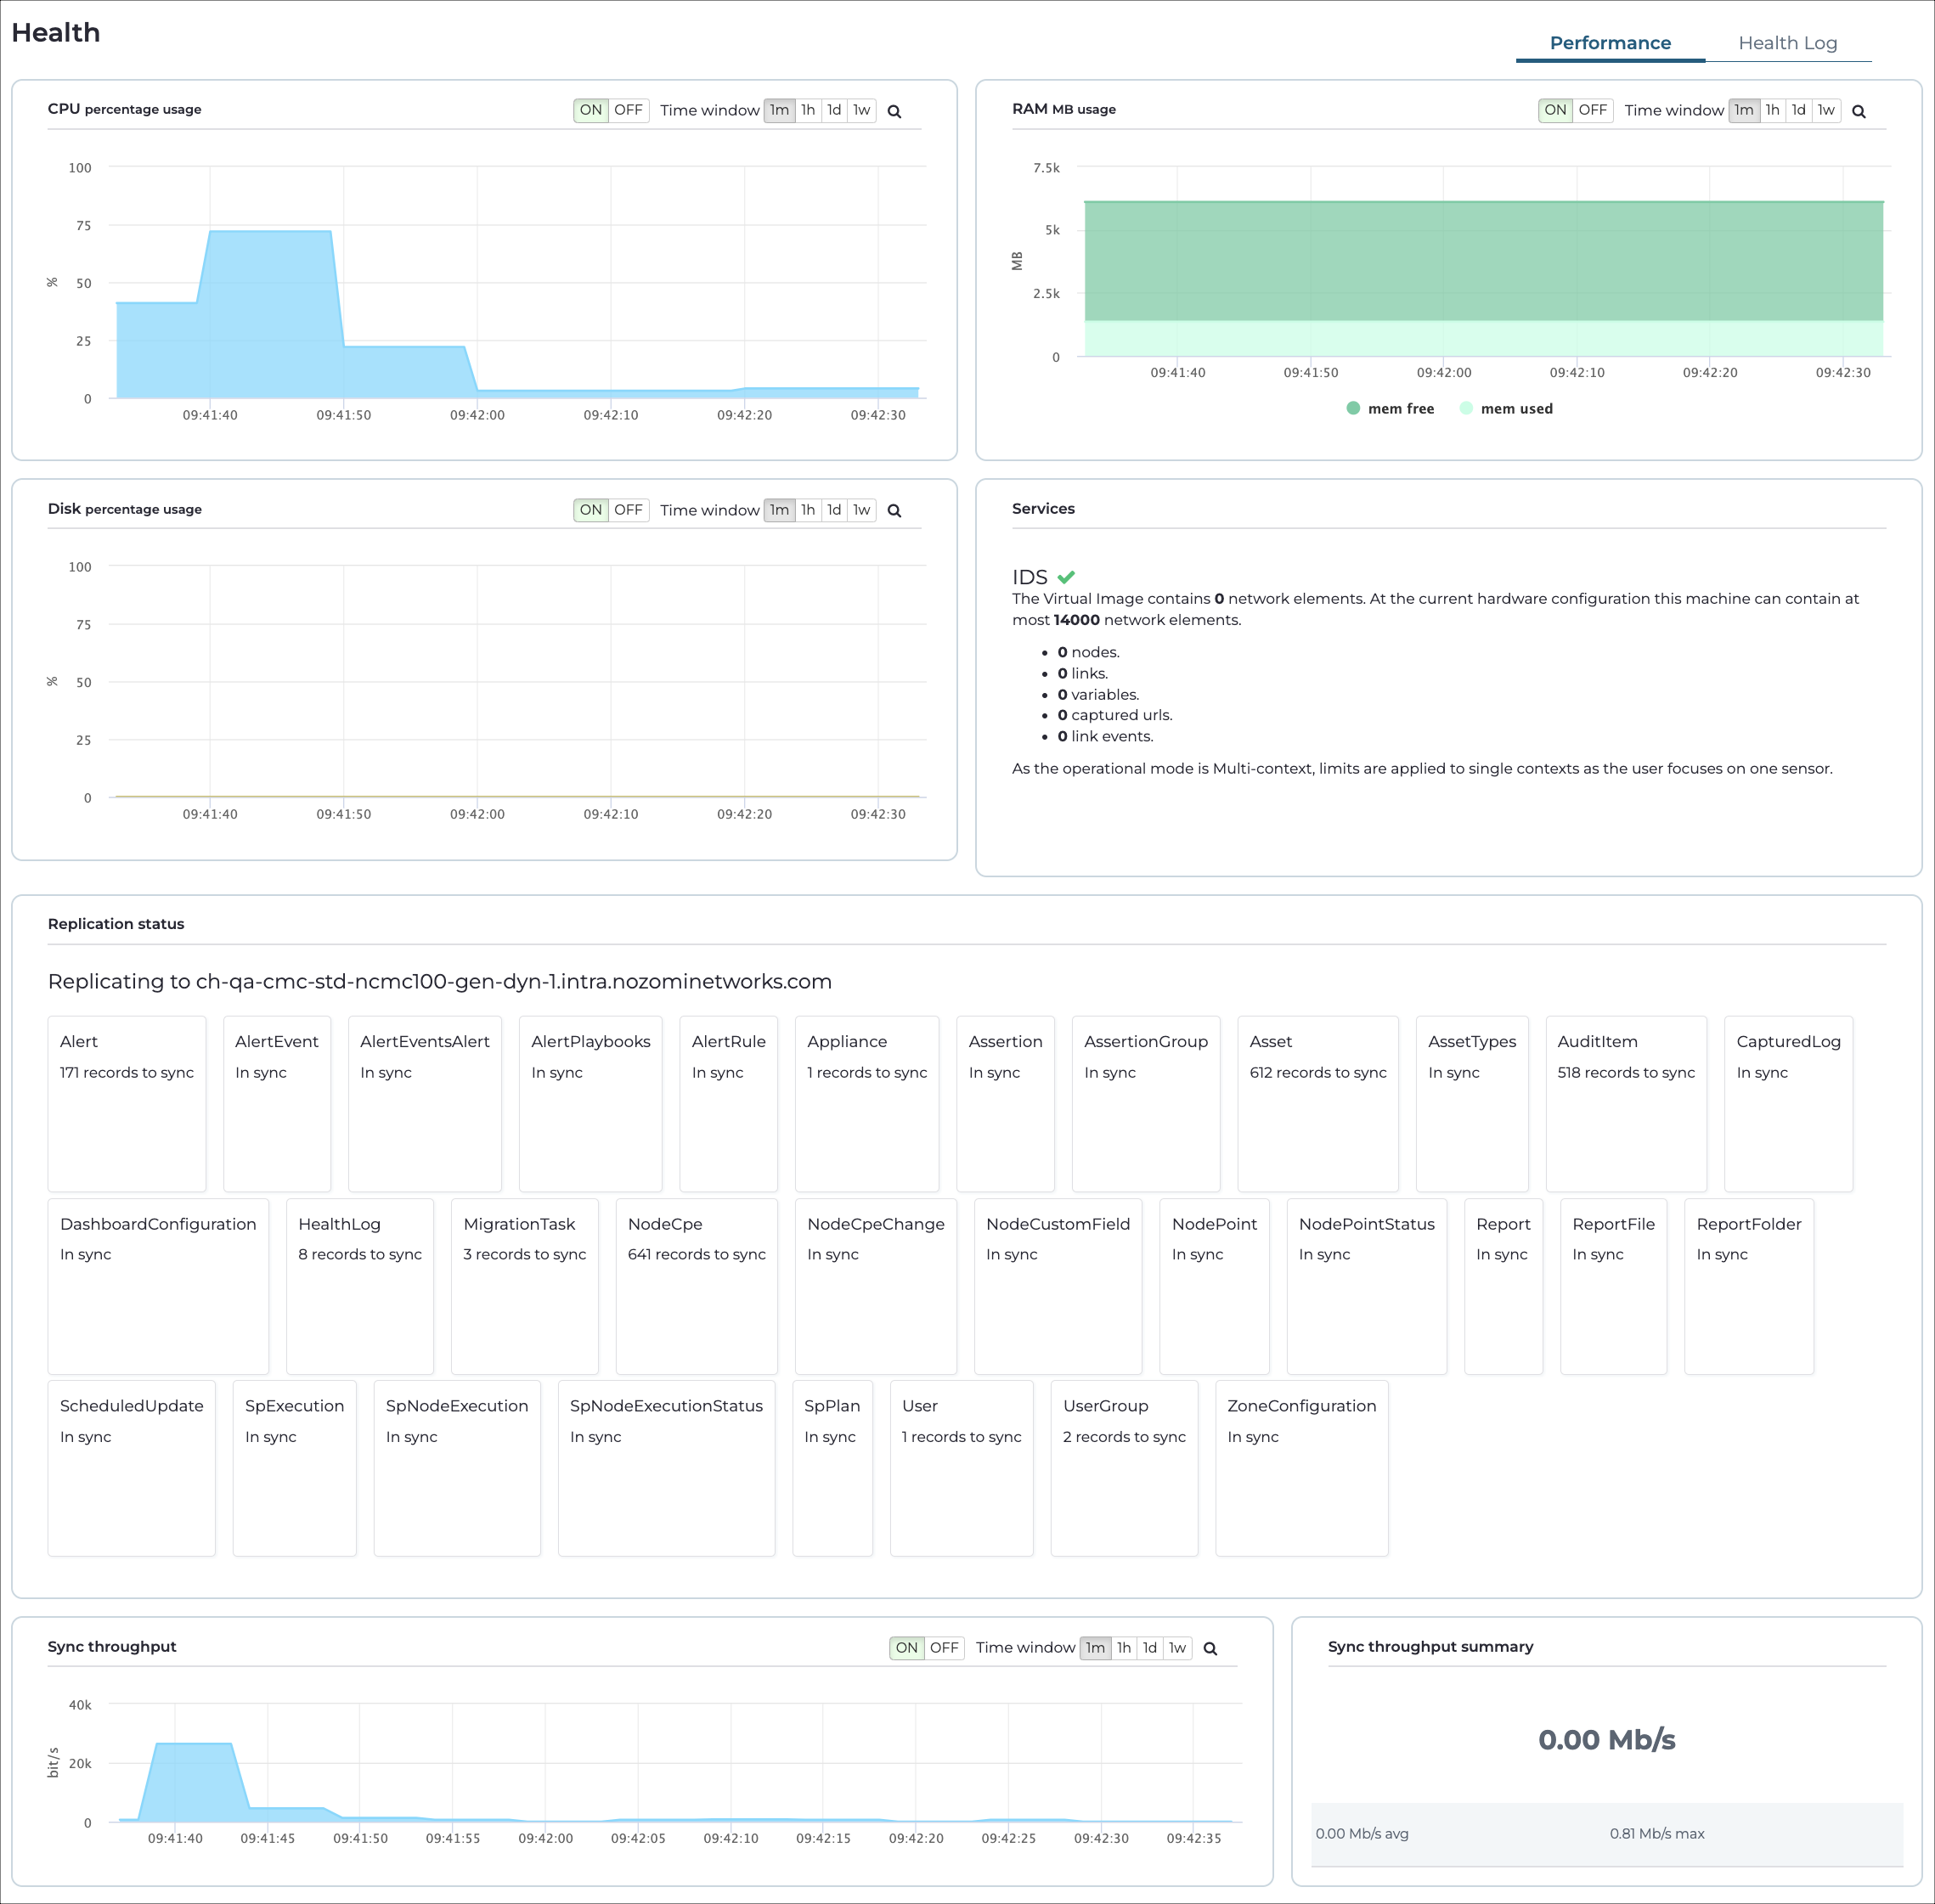
Graphs
The page shows graph for:
- CPU percentage usage
- RAM MB usage
- Disk percentage usage
- Services
- Replication status
- Sync throughput
- Sync throughput summary
The vertical axis show percentage usage and the horizontal axis shows time.
These sections have an ON/OFF toggle and time controls that
let you choose the timeframe of the window. You can choose between:
- One minute
- One hour
- One day
- One week
Services
This section shows information about:
- The intrusion detection system (IDS)
- Alerts
- Sandbox
- Trace
- Vulnerabilities