
Activity Log
Use the Activity Log page in Guardian to inspect the history of Smart Polling activities. Each record in the table represents an execution of a Smart Polling plan on a specific node.
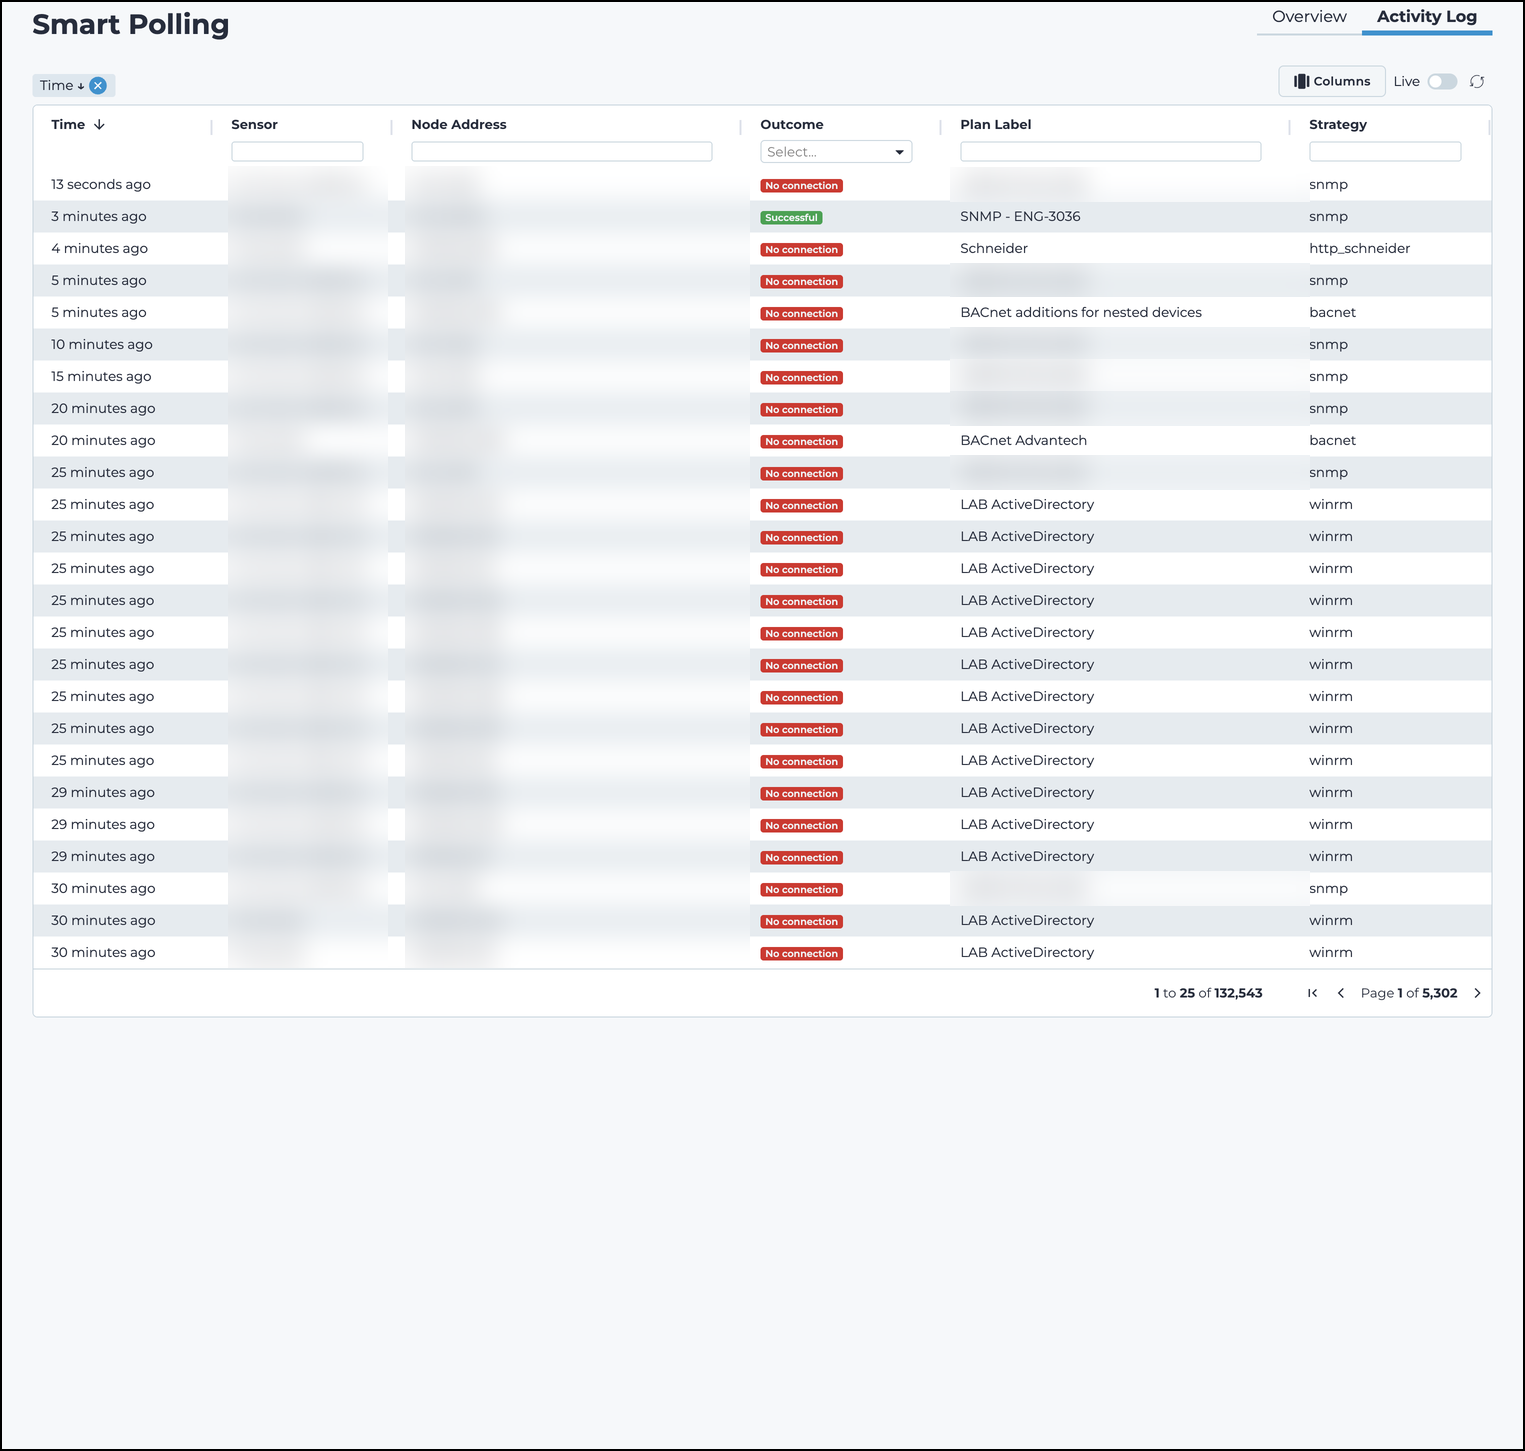
Node executions
The Activity Log page shows the node executions. These are the individual executions of Smart Polling on a specific node with a configured plan. The table gives a view that you can filter and sort.
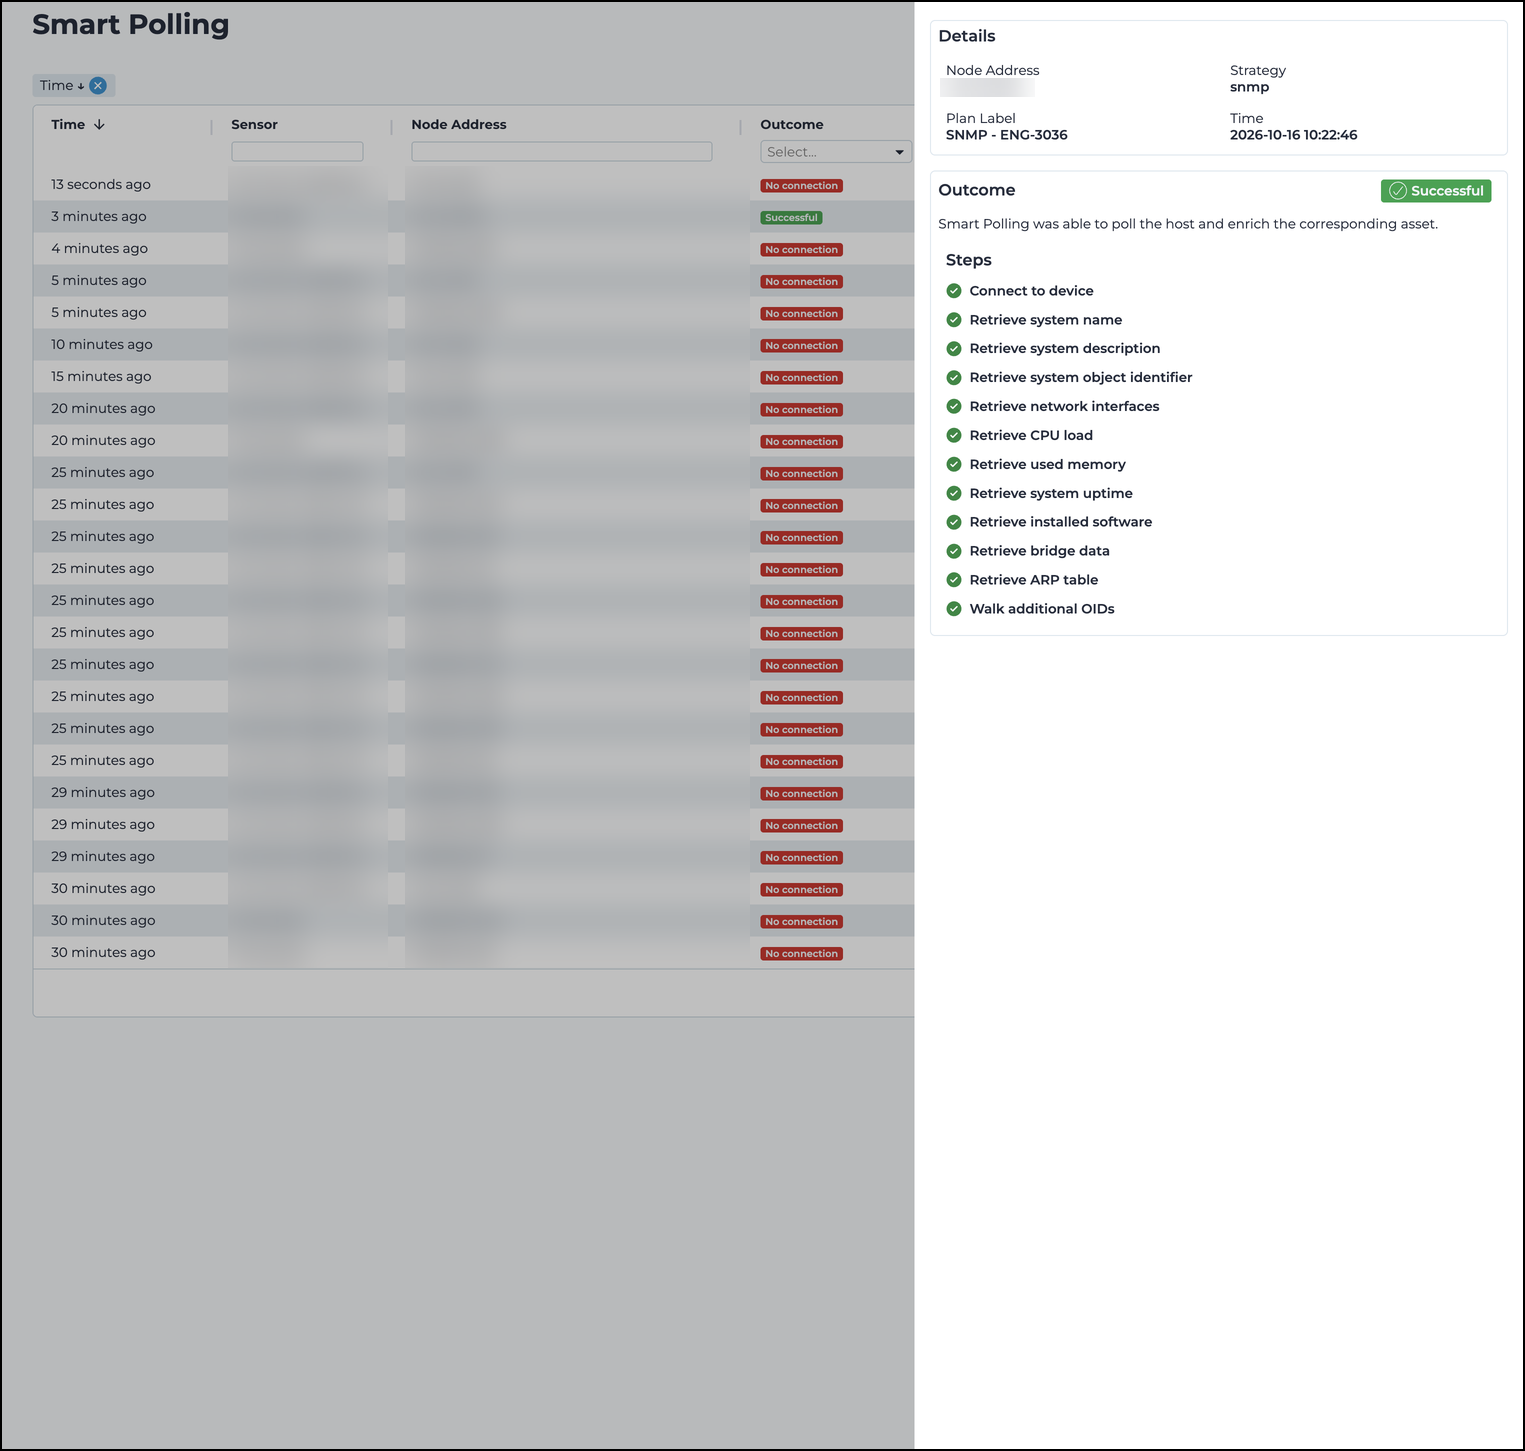
You can double-click a row in the table to open a sidebar with additional information. This includes a more granular report of the activity.
Column descriptions
| Column label | Description |
|---|---|
| Time | The time the sensor connected to the monitored node. |
| Sensor | The hostname of the sensor performing the poll. This can be the Guardian sensor or a connected Arc. When the poll runs on the Guardian itself, the value is This sensor. |
| Node address | The address of the polled node. |
| Outcome | The result of the polling. |
| Plan label | The label of the executed plan. |
| Strategy | The strategy of the executed plan. |